Project Aria Tools Python Visualization
Overview
This page introduces our core Python visualization tools, developed with Rerun, that are part of Project Aria Tools.
- Aria Sensor Viewer: 3D visualization of Aria sensors
- MPS Viewer: renders MPS metadata (point cloud, device trajectory and wearer eye gaze)
Requirements
- Python Project Aria Tools is installed
- MPS Sample data
- Official Sample Data - most up to date sample data
- GitHub Repo Sample dataset - useful for unit testing etc. It will work, but is not maintained and updated the way the official sample data is
Run Aria Sensor Viewer
viewer_aria_sensors displays the relative position and orientation of all most of Project Aria glasses sensors (cameras, IMUs, microphones, magnetometer & barometer) in a common reference.
viewer_aria_sensors --vrs $MPS_SAMPLE_PATH/sample.vrs
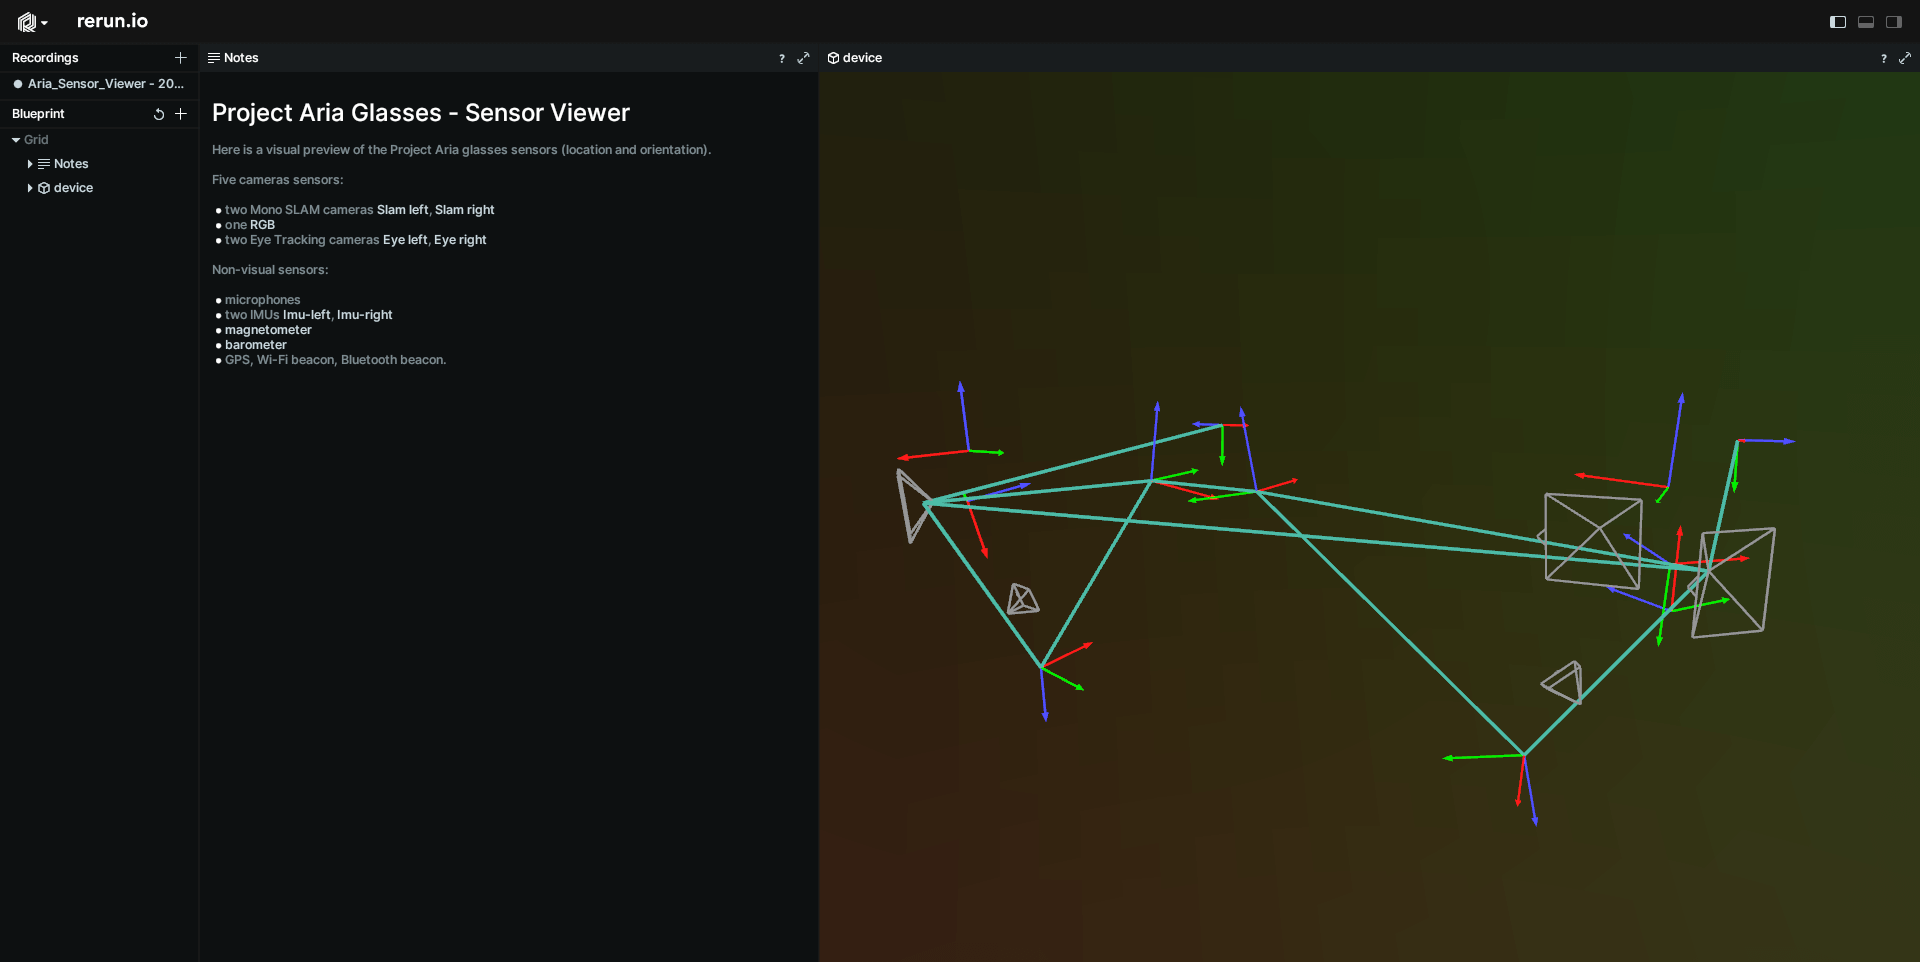
- Selecting the different sensors in the Blueprint left column will help you quickly identify where a given sensor is located
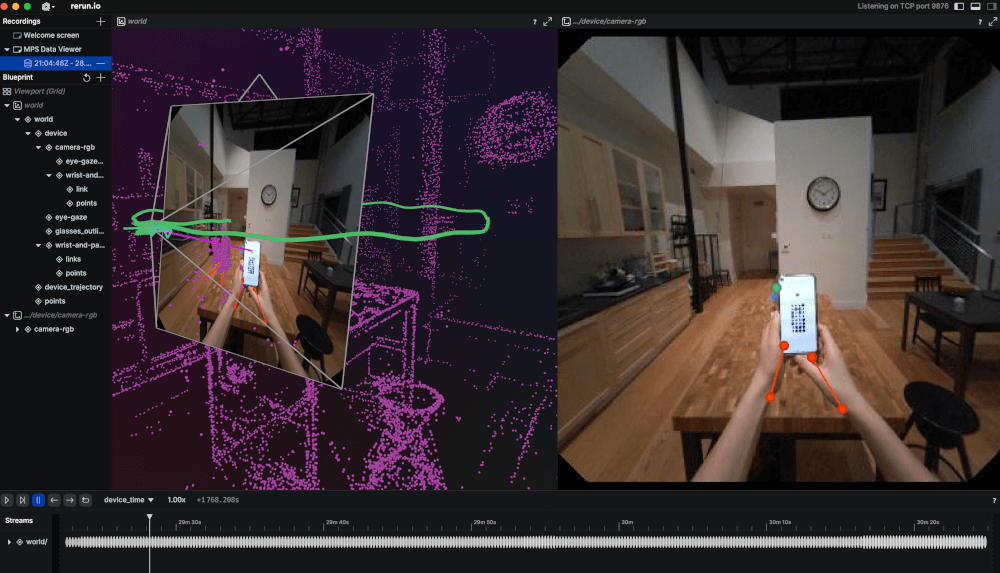
Run MPS Viewer
viewer_mps displays an interactive visualization of the Aria VRS RGB frames along with MPS data (Closed loop trajectory, Global point cloud, Wearer eye gaze).
As you are playing or moving along the timeline, you can see the position of the camera and the wearer eye gaze direction at the timestamp of your choice.
viewer_mps --vrs $MPS_SAMPLE_PATH/sample.vrs
or to specify each MPS file
viewer_mps --vrs $MPS_SAMPLE_PATH/sample.vrs \
--trajectory $MPS_SAMPLE_PATH/trajectory/closed_loop_trajectory.csv \
--points $MPS_SAMPLE_PATH/trajectory/global_points.csv.gz \
--eyegaze $MPS_SAMPLE_PATH/eye_gaze/personalized_eye_gaze.csv \
--hands $MPS_SAMPLE_PATH/hand_tracking/wrist_and_palm_poses.csv
- Switching between device_time and timestamp timeline allows you to retrieve a specific timestamp for the VRS sequence or MPS annotation
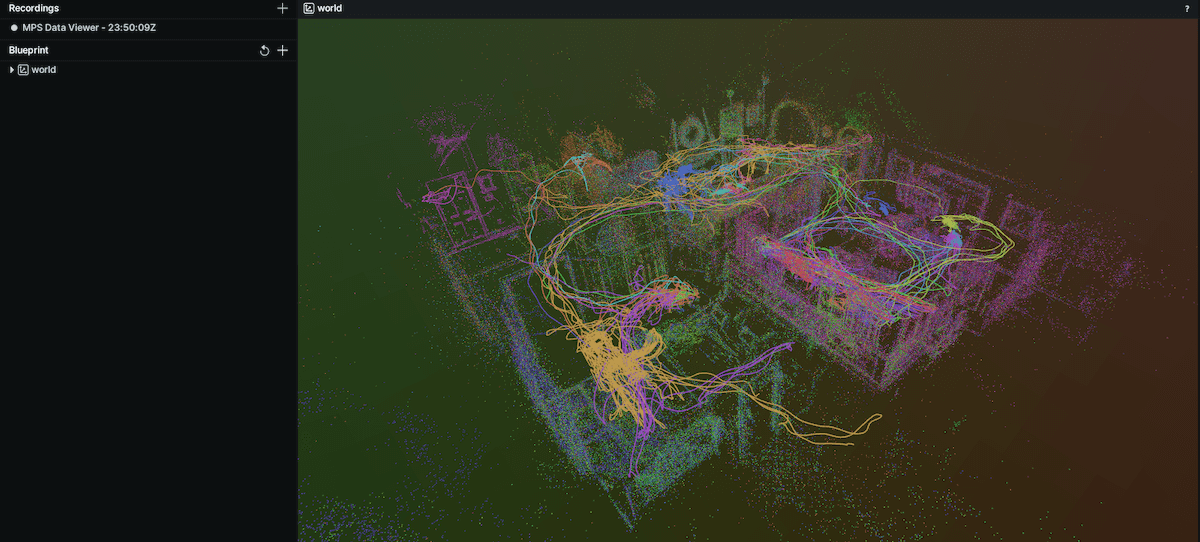
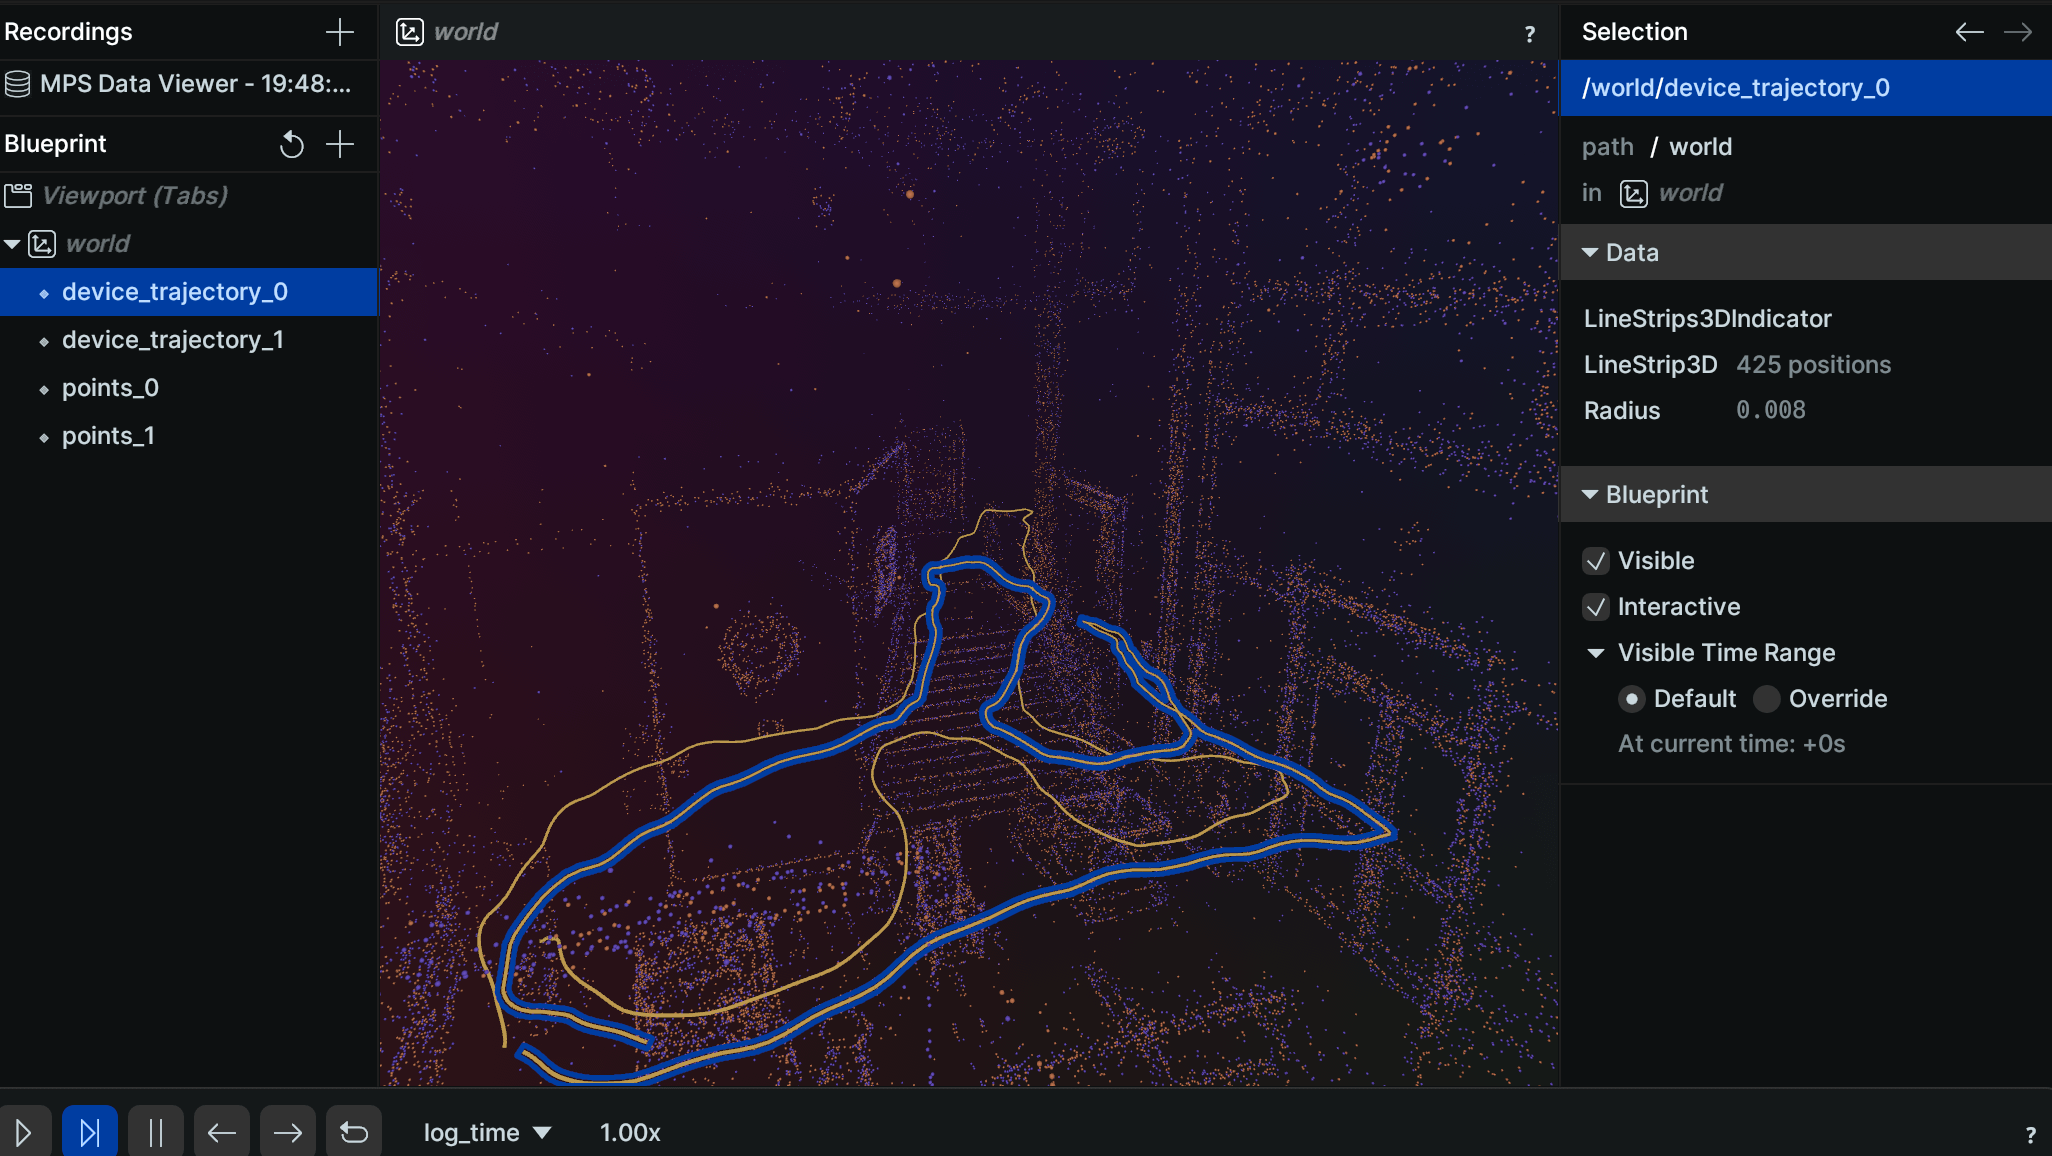
Visualization of Multi-SLAM data
The MPS Viewer can also be used to visualize 3D data derived from multiple Project Aria device recordings, if the MPS data has been generated using Multi-SLAM or is part of datasets that contain this type of data, such as Aria Everyday Activities (AEA).
AEA Example
The example below uses Trajectory and Semi-Dense Point Cloud data from AEA. Go to AEA Dataset Download for how to download this data.
viewer_mps --trajectory `find -P ~/Documents/projectaria_tools_aea_data/loc1*/*/*/closed_loop_trajectory.csv -print` --points `find -P Documents/projectaria_tools_aea_data/loc1*/*/*/semidense_points.csv.gz -print`
MPS CLI Example
The following visualization uses Multi-Slam data generated using MPS CLI sample data. The MPS CLI is part of the Aria Research Kit.
viewer_mps --trajectory `find -P ~/documents/multi_slam_output/*/*/closed_loop_trajectory.csv -print` --points `find -P ~/documents/multi_slam_output/*/*/semidense_points.csv.gz -print`
An introduction to Rerun
Rerun is an open source SDK and engine for visualizing and interacting with multi modal data streams. It's usable from Python, Rust and C++. Rerun consists in a log API and a visualizer.
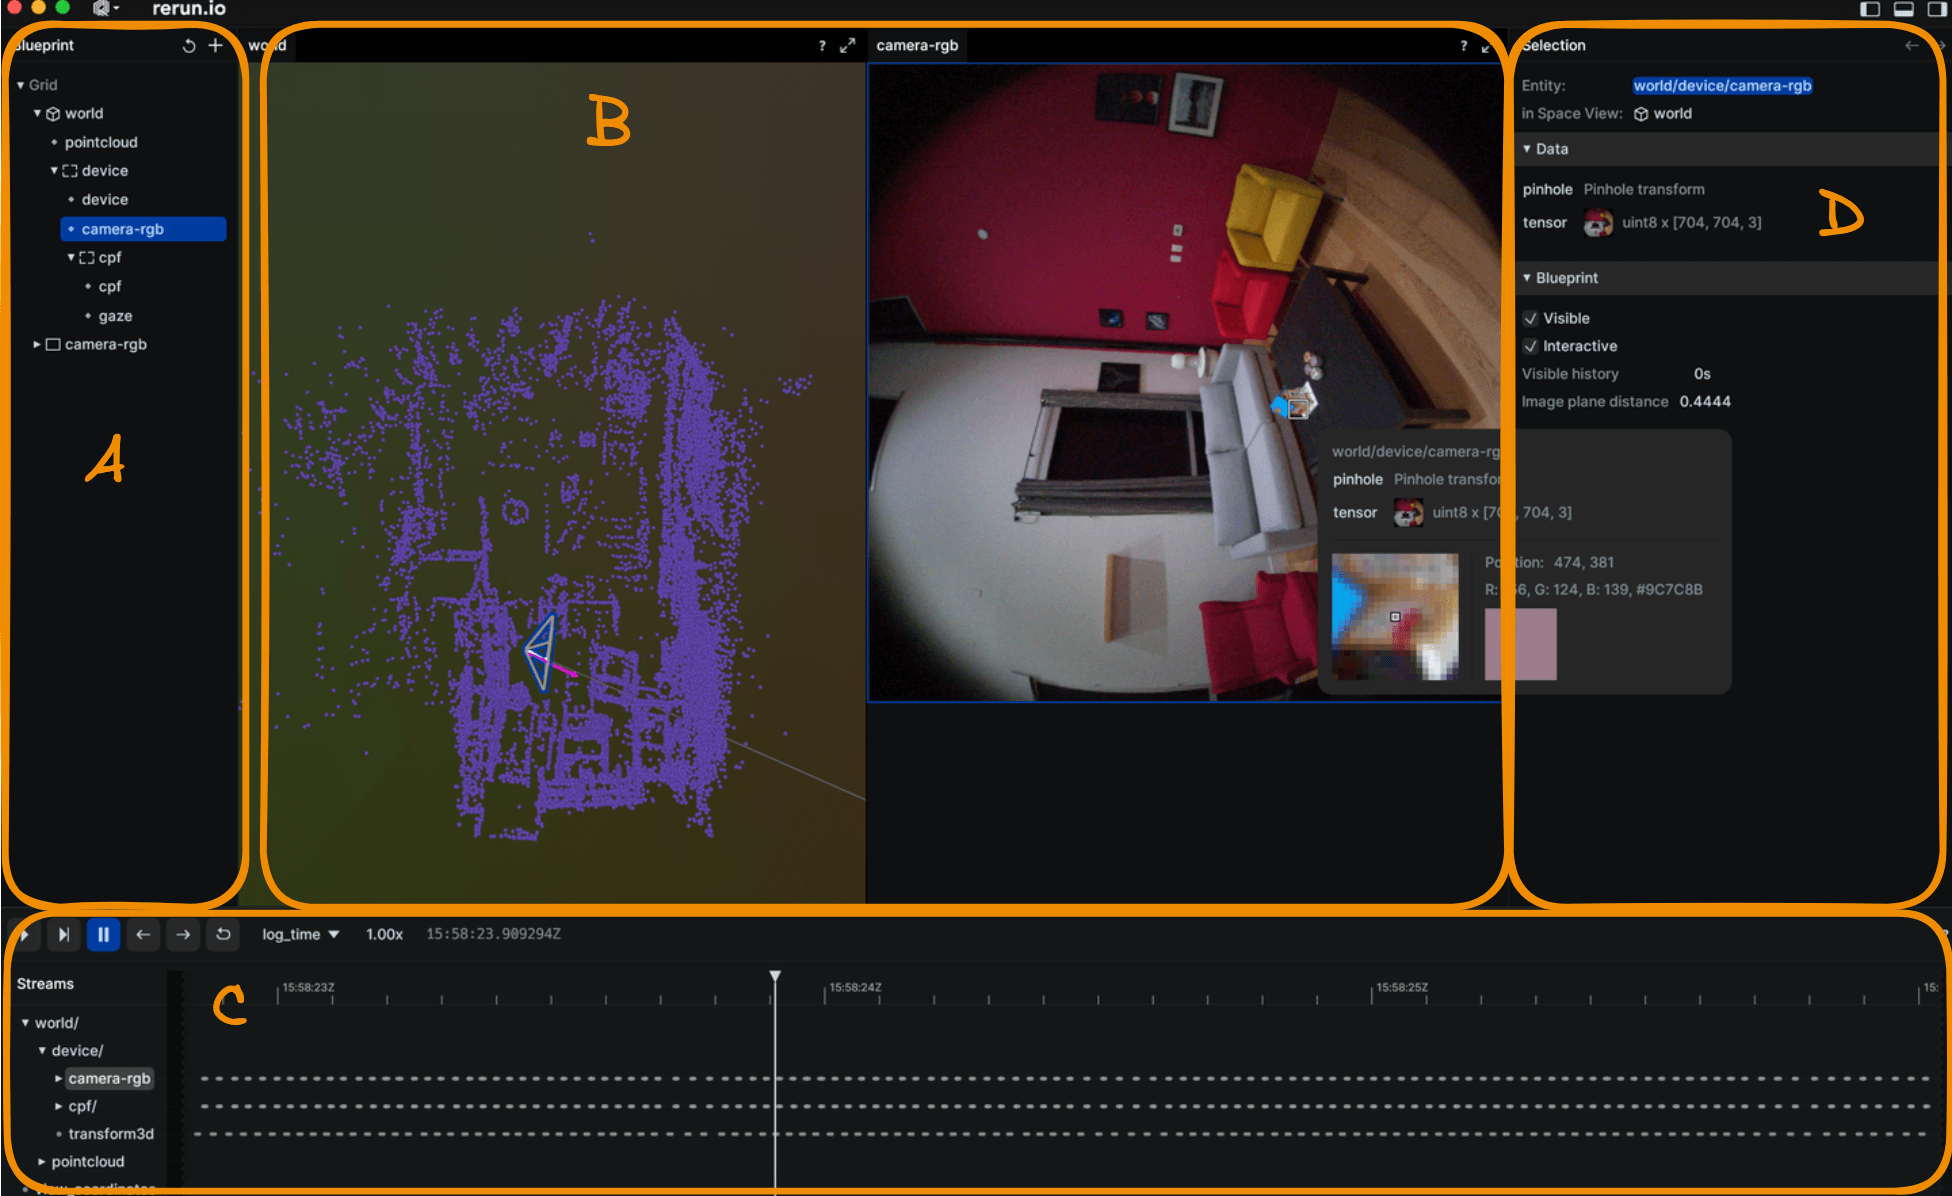
The main GUI sections of the Rerun visualizer are:
- BluePrint
- A: User defined Scene Graph (Entities and hierarchy you define)
- B: Visual view of the Scene Graph (User customizable)
- Timeline
- C: Interactive navigation and inspection of log events on multiple timeline (log, frame, or device time)
- Visibility and property control
- D: Fine grained control and inspection of Entities/Components