Resolving the Bottleneck
Say we find a bottleneck in a pipeline (or narrow down to a few suspects) by analyzing the runtime statistics, how can we optimize it?
The following is common approaches we can try.
Adjust the concurrency
Adjusting the concurrency is effective for preprocessing with light to medium
load.
With SPDL, typically 4 or 8 is enough. It should not go beyond
#of CPU cores / 8.
When the preprocessing is CPU-intensive, (like decoding videos), increasing the
concurrency can cause the noisy neighbour effect,
so care must be taken.
Restructure the stages
Data loading is composed of stages bound by different factors.
downloading is bound by network bandwidth and API call rate.
preprocessing is bound by CPU and memory.
GPU data transfer is bound by the cable spec.
When migrating existing pipelines, there were cases where all the logics are squashed into one function. Splitting such function into subroutines gives more granular control over the pipeline.
Profiling the function
There are many useful tools for finding out where in a function is the bottleneck.
Tracer
A tracer like PyTorch Profiler can trace the program execution. It allows to see how much time is being spent on what operation.
The following figure shows a function making multiple network calls.
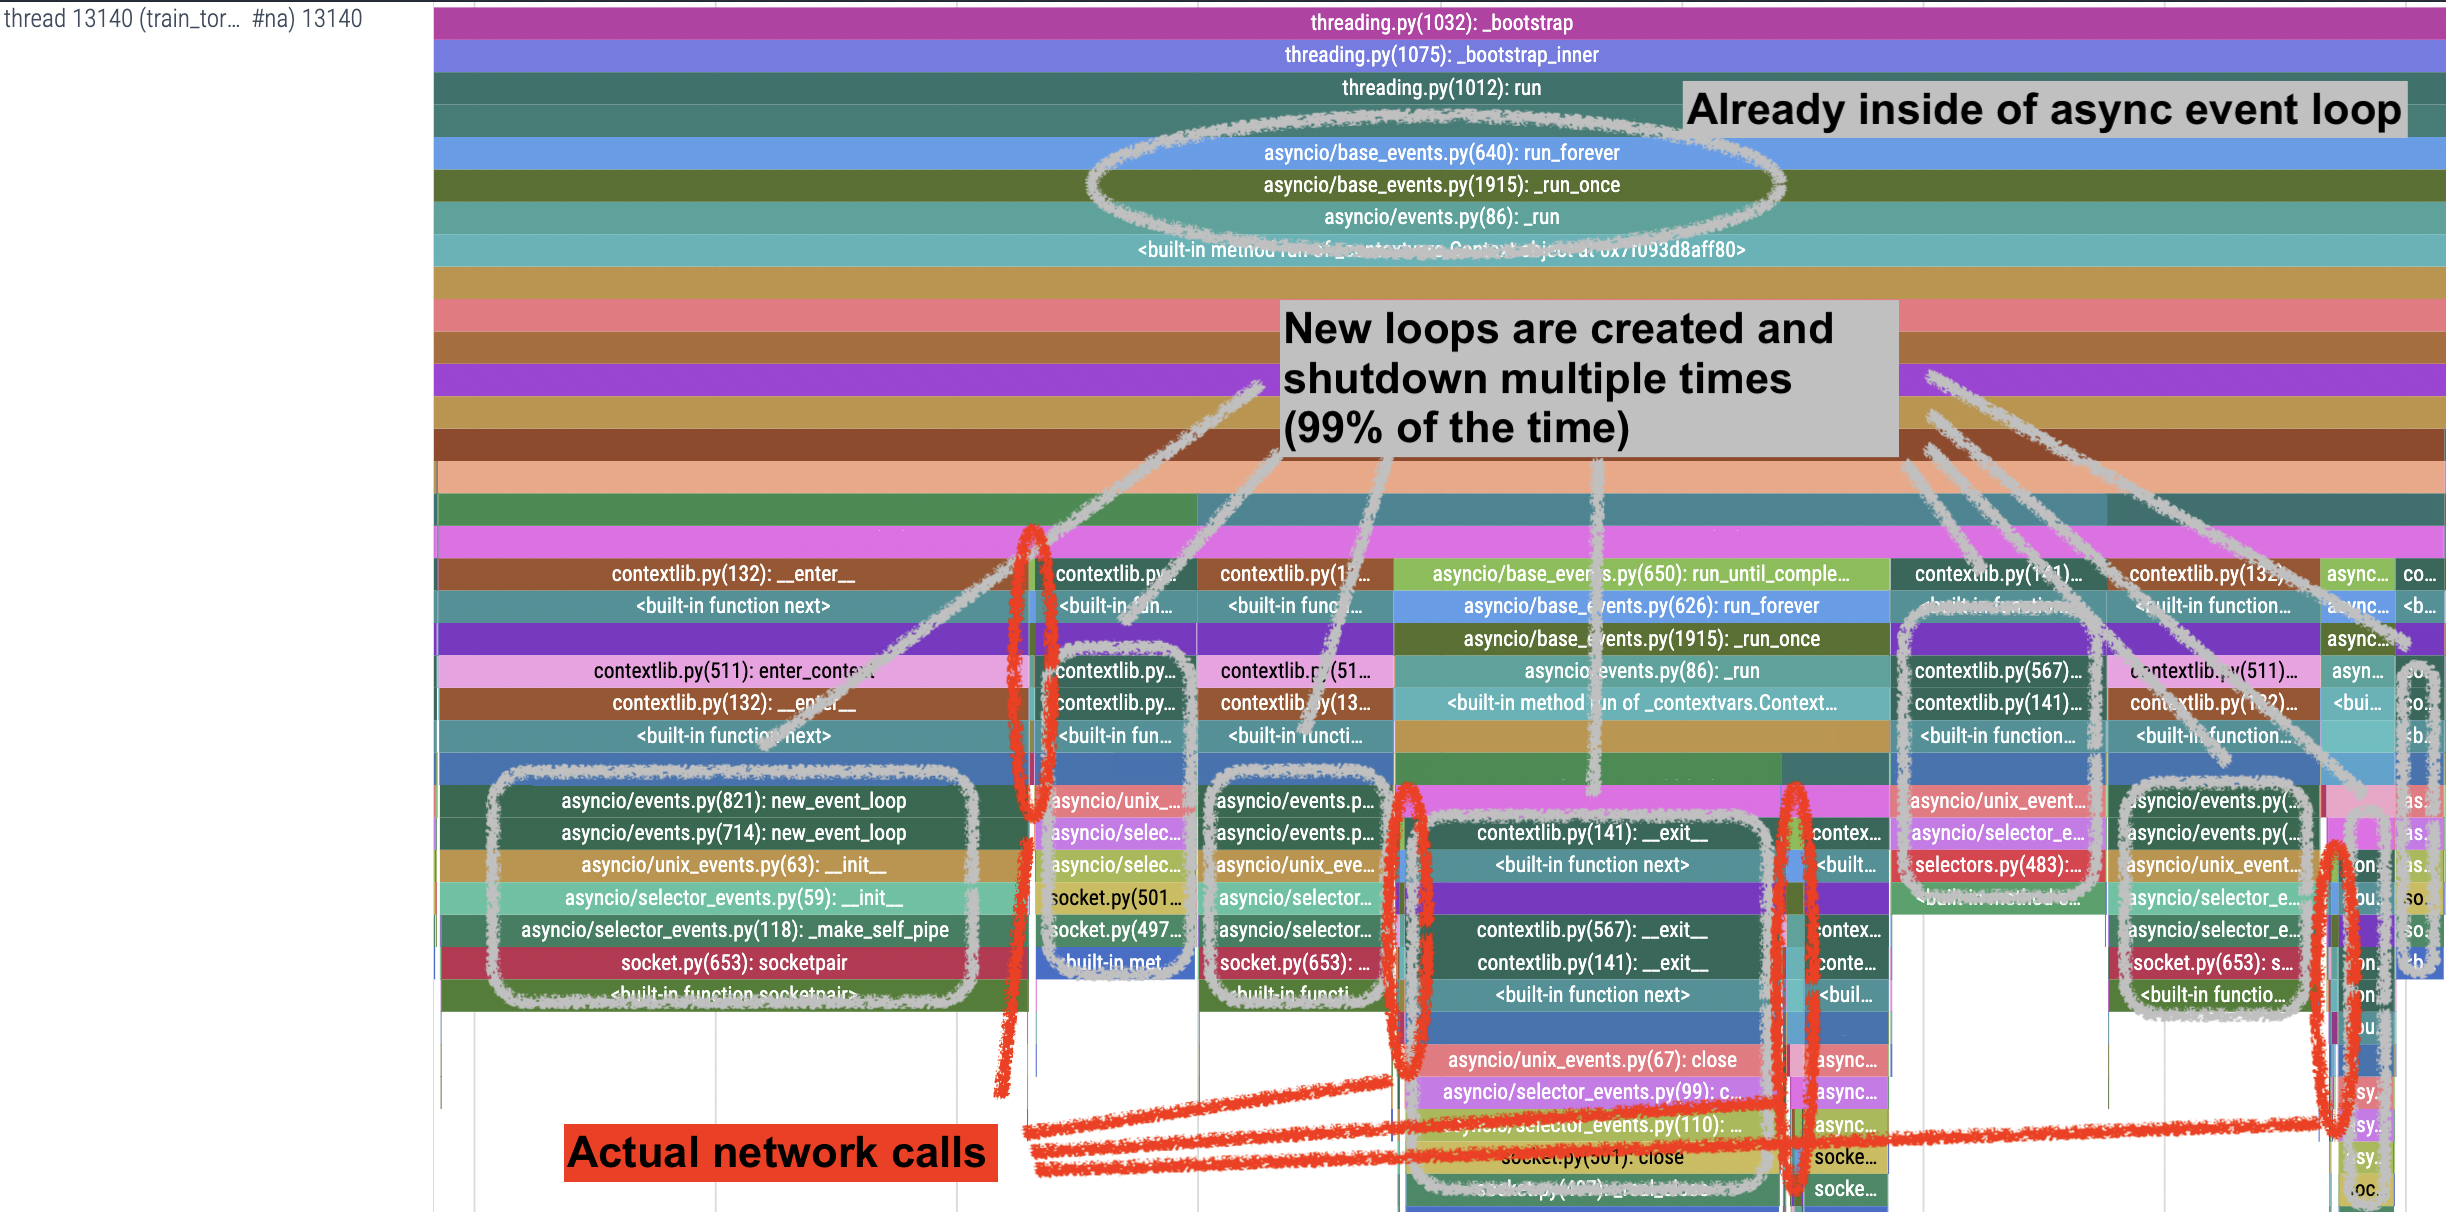
The underlying API is defined with async keyword.
It is a common practice (although it’s an anti-pattern) to wrap async
functions with asyncio.run() to provide pseudo synchronous API
for the sake of ease of use.
As a result, users are not aware that an event loop is created and
destroyed for each invocation of API call, which is redundant and
inefficient especially when the series of calls are made in event loop.
This is what is happening in the above figure.
The function is being executerd in asynchronous event loop, but it is calling pseudo synchronous API, so an event loop is created and destroyed for each call. As a result it is spending x100 more time.
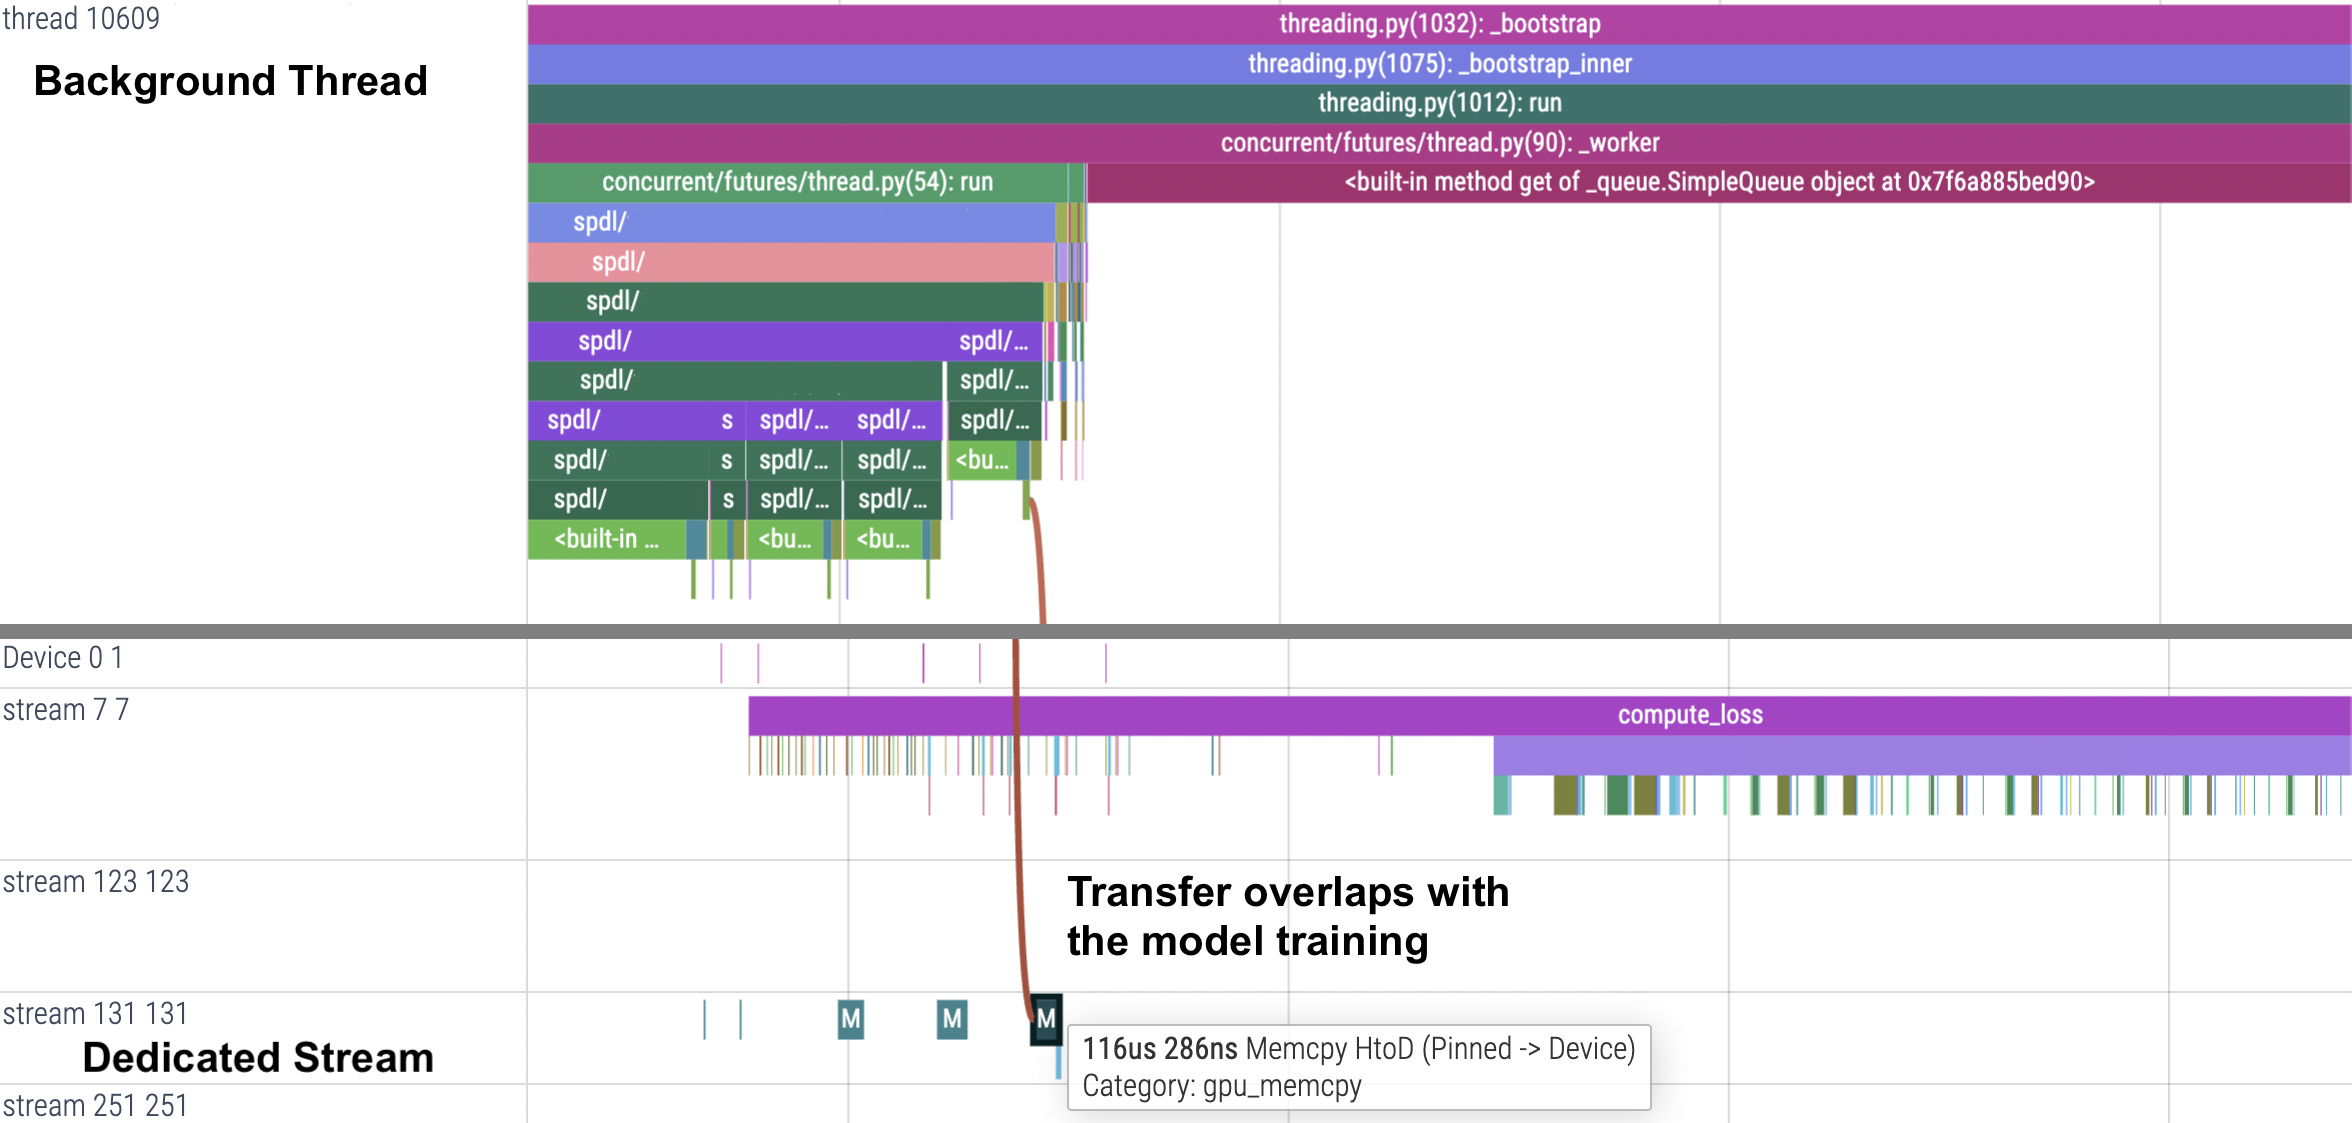
The PyTorch Profiler also annotates GPU and Tensor metadata, so it is useful to verify GPU-related activities. For example, to ensure that the data transfer is not interrupting the the main training, we can check that the data transfer is happening in a separate stream.
Sampler
Another common approach for profiling a function is by sampling.
You can use perf to collect stats and visualize it with FlameGraph.
At Meta, we have Strobelight enabled for production pipelines.
You can look for a particular function that’s taking up significant portion of execution time.