Collecting Runtime Statistics¶
See also
Please check out the complete example of performance_analysis, which shows
how to log the runtime performance statistics to TensorBoard.
Note
If you are Meta employee, please refer to this.
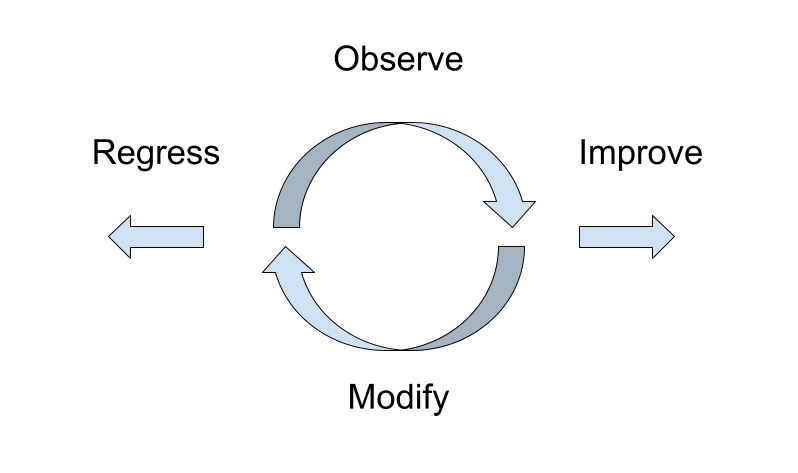
The process of optimizing performance is driven by continuous observation, analysis, and iterative improvement. It is utmost important to measure the performance, so that one can find the bottleneck and improves it.
The SPDL is designed in a way that allows to collect runtime statistics and export them so that one can analyze and determine the bottleneck.
In this section, we explain how you can export the statistics. (We will go over the detail of how to analyze the statistics in Optimization Guide.)
There are two kinds of statistics that Pipeline collects,
TaskPerfStats and QueuePerfStats.
The TaskPerfStats carries the information about functions passed to
Pipeline.pipe(), and it is collected by TaskStatsHook.
The QueuePerfStats carries the information about the flow of data going
through the pipeline, and it is collected by StatsQueue.
The following are the steps to export the stats.
Subclass
StatsQueueandTaskStatsHookand overrideinterval_stats_callbackmethod.†In the
interval_stats_callbackmethod, save the fields ofQueuePerfStatsto a location you can access later. ††For
StatsQueue, provide the class object (not an instance) toPipelineBuilder.build()method.For
TaskStatsHook, create a factory function that takes a name of the stage function and returns a list ofTaskHooks applied to the stage, then provide the factory function toPipelineBuilder.build()method.
Note
- When overriding the method, ensure that it does not hold the GIL, as this can degrade pipeline performance.
- The destination can be anywhere such as a remote database, or a local file.