How It Works
Overview
Autoresearch operates in three phases:
Initialization – Instrument the pipeline with metrics logging and GC alignment, establish a baseline, and measure headspace.
Seed experiments – Launch structural optimizations that are known to be high-impact (baseline measurement, headspace analysis, subprocess pipeline).
Iterative optimization – The coding agent analyzes results, proposes follow-up experiments, and the engine executes them concurrently until metrics plateau.
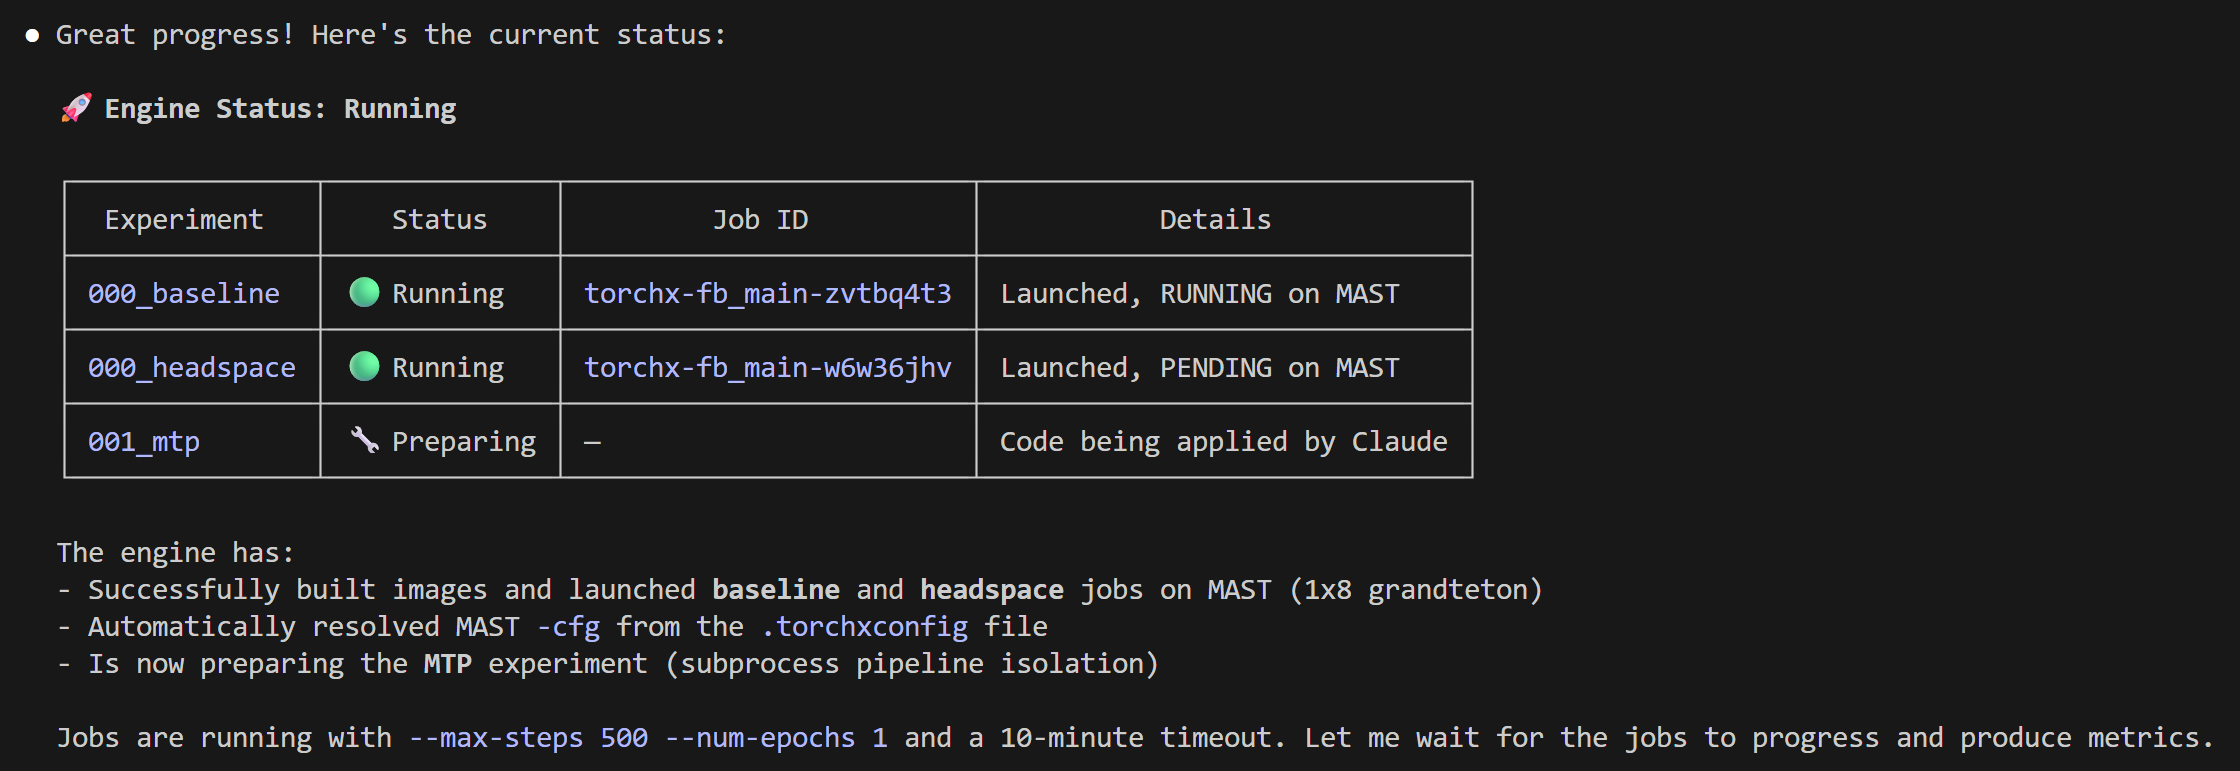
The system is built as two tiers: an interactive supervisor agent that gathers configuration and monitors progress, and a non-interactive async engine that runs the experiment loop. The supervisor starts the engine in the background and can inspect workdir state while experiments run.
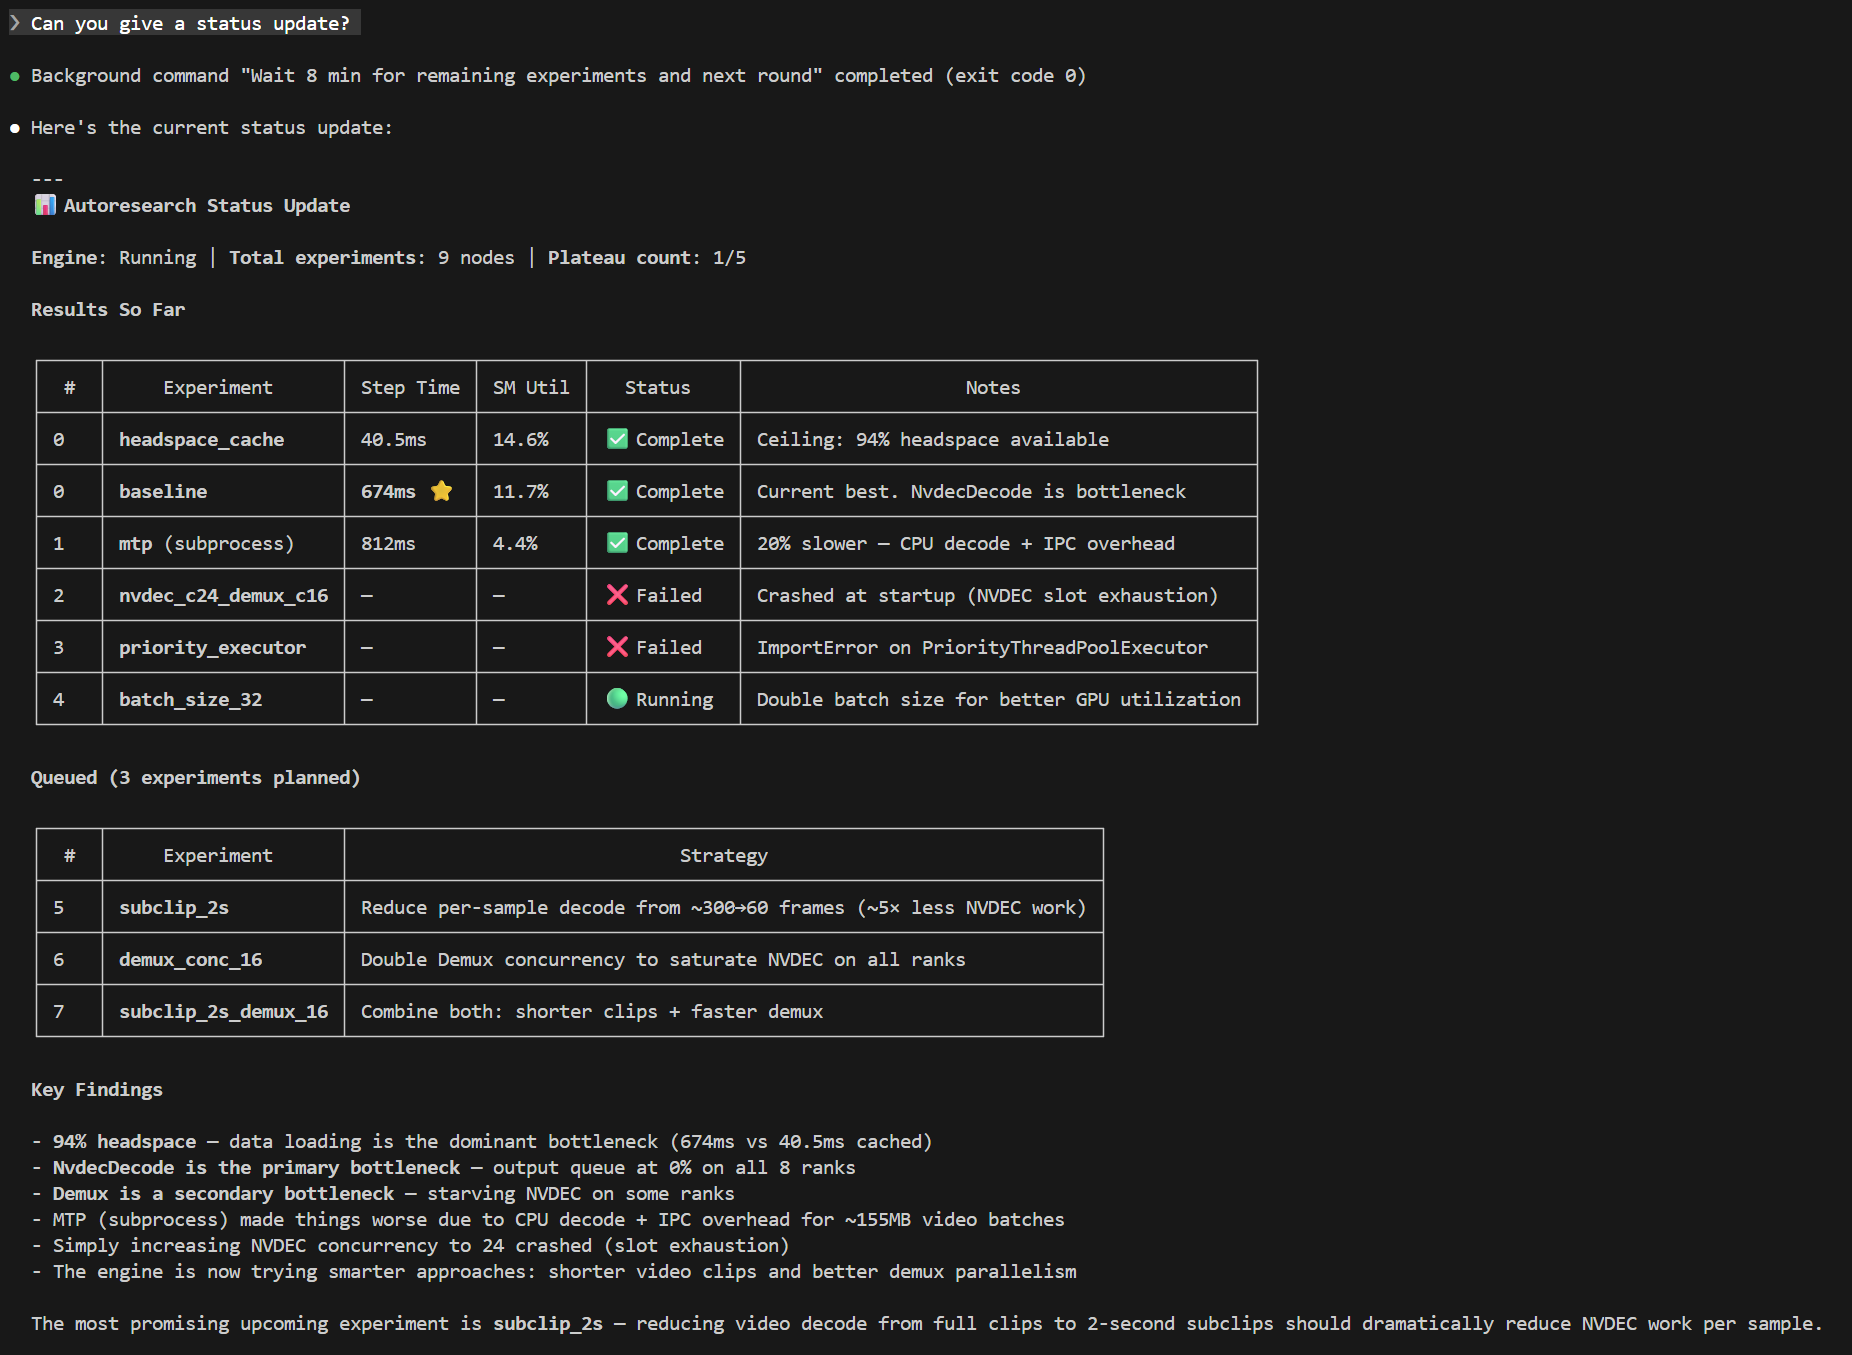
The following screenshot shows the supervisor agent reporting on an active autoresearch run — experiment table, running jobs, findings, and diagnostics are all visible in one status query:
Getting Started
The recommended entry point is the supervisor subcommand, which
launches an interactive supervisor agent that gathers missing
configuration, starts the engine, and monitors progress:
spdl autoresearch supervisor <workdir> \
  --pipeline-script <path/to/pipeline.py> \
  --source-dir <path/to/source/> \
  --build-command "<build command>" \
  --base-launch-command "<launch command with \$IMAGE>"
The supervisor asks for any missing values interactively. Once configuration is complete, it launches the engine in the background and reports progress as experiments complete.
To run the engine directly without a supervisor (non-interactive mode):
spdl autoresearch engine \
  --workflow spdl.autoresearch.pipeline_optimization:create_workflow \
  --workdir <workdir> \
  --max-concurrency 3 \
  --platform auto \
  -- \
  --pipeline-script <path/to/pipeline.py> \
  --source-dir <path/to/source/> \
  --build-command "<build command>" \
  --base-launch-command "<launch command with \$IMAGE>" \
  --max-iterations 10 \
  --patience 3 \
  --job-timeout 1800
Note the -- separator: arguments before it are framework engine
flags (--workflow, --workdir, --max-concurrency,
--platform); arguments after it are forwarded to the workflow
factory.
The engine requires the following inputs:
A pipeline script – the Python file containing the SPDL pipeline to optimize.
A source directory – the directory containing the pipeline code. The engine modifies files in this directory during experiments.
A build command – how to build the job image (e.g.,
docker build).A launch command template – the command to launch a training job. Use
$IMAGEas a placeholder for the image name.
Configuration is persisted to <workdir>/config.json on the first run.
To resume after an interruption, simply re-run with the workdir alone:
spdl autoresearch supervisor <workdir>

# or directly:
spdl autoresearch engine \
  --workflow spdl.autoresearch.pipeline_optimization:create_workflow \
  --workdir <workdir>
How It Works
Instrumentation
On the first run, the engine automatically instruments the pipeline
script with TTFB (time to first batch), per-step timing, and GC
alignment (gc.disable() + periodic gc.collect()). The
pipeline source is sent to the coding agent with instructions to add
lightweight logging and GC management.
The instrumented code is committed to source control (Sapling or Git), creating a clean baseline for subsequent experiments to branch from.
Seed Experiments
The engine schedules three seed experiments before entering the iterative loop. Each addresses a known high-impact area and forms a root node in the hypothesis tree.
Baseline
The unmodified pipeline is run to establish baseline metrics: step time, GPU SM utilization, data readiness, and throughput. All subsequent experiments are compared against this baseline.
Headspace analysis
As described in Headspace Analysis, the pipeline is wrapped with
CacheDataLoader to measure the upper
bound of improvement achievable by optimizing data loading. If the
headspace is near zero, the bottleneck is model compute, not data
loading. The engine uses this information to decide which optimizations
to prioritize.
Subprocess pipeline (MTP)
The pipeline is moved to a subprocess to eliminate GIL contention between the data loading threads and the training loop. This is often a high-impact optimization, as discussed in resolution. By running the pipeline in a separate process, the data loading threads no longer compete with PyTorch for the GIL.
Iterative Optimization
After the seed experiments, autoresearch enters an iterative loop:
Analyze – When a job completes, the workflow collects system metrics (GPU SM utilization, CPU utilization) and SPDL pipeline statistics (per-stage execution time, queue occupancy, throughput). These are sent to the coding agent, which produces a structured analysis identifying the bottleneck and evaluating the experiment’s hypothesis.
Plan – The coding agent receives the full experiment history, the current best metrics, and the pipeline source code. Based on this context, it proposes follow-up experiments. Each proposal includes a hypothesis, the specific changes to make, and whether the image needs rebuilding.
Execute – The workflow applies code changes (if any), builds the image, and launches jobs. Up to
max_concurrencyjobs run simultaneously. Each job is monitored for completion and timeout.Repeat – The loop continues until the stopping conditions are met: metrics have not improved for
patienceconsecutive planning sessions and all known best practices have been tried.
Monitoring
All experiment state lives in the workdir. The following files are useful for monitoring progress.
engine/engine_state.jsonEngine status (
running,interrupted, orstopped) and experiment counts (queued, running, completed, failed).engine/checkpoint.jsonRunner checkpoint containing the serialized queued and running
WorkSpecobjects. This is the source of truth for resume.engine/queue.jsonMonitoring view of pending experiments in priority order.
engine/active.jsonMonitoring view of currently running remote jobs.
summary.mdHuman-readable progress summary updated after each job completion.
master_table.tsvTab-separated table of all experiments with key metrics: throughput, step time, SM utilization, data readiness, and duration.
progress.pngMulti-panel progress chart showing throughput, steady-state step time, SM utilization, duration, and raw SM utilization over time. Green dots indicate improvements over the previous best; the dashed line shows the headspace ceiling/floor.
hypothesis_tree.pngTree visualization of the experiment hierarchy. Nodes are color-coded: green for improved, gray for no improvement, red for failed, blue for running, and dashed white for queued.
runs/<run_id>/analysis.mdThe coding agent’s detailed analysis for each completed experiment, including per-stage pipeline metrics and bottleneck identification.
Generating a Summary
At any time during or after a run, generate a summary report:
spdl autoresearch summary <workdir>
This prints a deterministic snapshot of the workdir state (master
table, live summary, recorded failures) to stdout. It does not
invoke a coding agent. When the engine exits cleanly, it
automatically writes <workdir>/report.md with the same content.
Stopping and Resuming
To stop autoresearch gracefully, send SIGINT (Ctrl+C) to the
process. The engine cancels local coroutines and persists queued and
running specs to engine/checkpoint.json with status
interrupted.
Warning
Do not send SIGKILL (kill -9) to the engine process.
This prevents state persistence and you may lose the queue and
in-progress analysis.
Running jobs on the cluster are not cancelled when autoresearch
stops. They continue independently. When autoresearch resumes from
engine/checkpoint.json, the workflow re-checks their status and
collects results.
To resume, simply re-run with the workdir:
spdl autoresearch supervisor <workdir>

# or directly:
spdl autoresearch engine \
  --workflow spdl.autoresearch.pipeline_optimization:create_workflow \
  --workdir <workdir>
Modifying the Queue
To manually adjust the experiment queue, stop the engine and edit
engine/checkpoint.json. The queued list contains serialized
WorkSpec objects; change their priority values or remove specs
as needed. Lower values run first. engine/queue.json is a
monitoring view and should not be treated as the resume source of truth.
Workdir Structure
<workdir>/
├── config.json                 # Experiment configuration
├── state.json                  # Persistent state (history, best metrics)
├── workflow_factory.json       # Workflow factory specifier for resume
├── master_table.tsv            # All experiments and their metrics
├── summary.md                  # Human-readable progress summary
├── report.md                   # Final report (written on clean exit)
├── progress.png                # Multi-panel progress chart
├── hypothesis_tree.png         # Experiment tree visualization
├── engine/
│   ├── checkpoint.json         # Runner checkpoint for resume
│   ├── engine_state.json       # Engine status and counts
│   ├── tree.json               # Full hypothesis tree
│   ├── queue.json              # Pending experiments (monitoring view)
│   ├── active.json             # Currently running jobs (monitoring view)
│   └── nodes/
│       └── <node_id>/
│           ├── spec.json       # Experiment specification
│           ├── status.txt      # Current status
│           └── result.json     # Analysis results
├── runs/
│   └── <run_id>/
│       ├── analysis.md         # Coding agent's analysis
│       └── metrics/            # Raw metrics data
└── logs/
    ├── autoresearch.log        # Full execution log
    ├── *_prompt.md             # Prompts sent to the coding agent
    ├── *_output.md             # Coding agent's responses
    └── *_raw.json              # Raw response JSON with cost
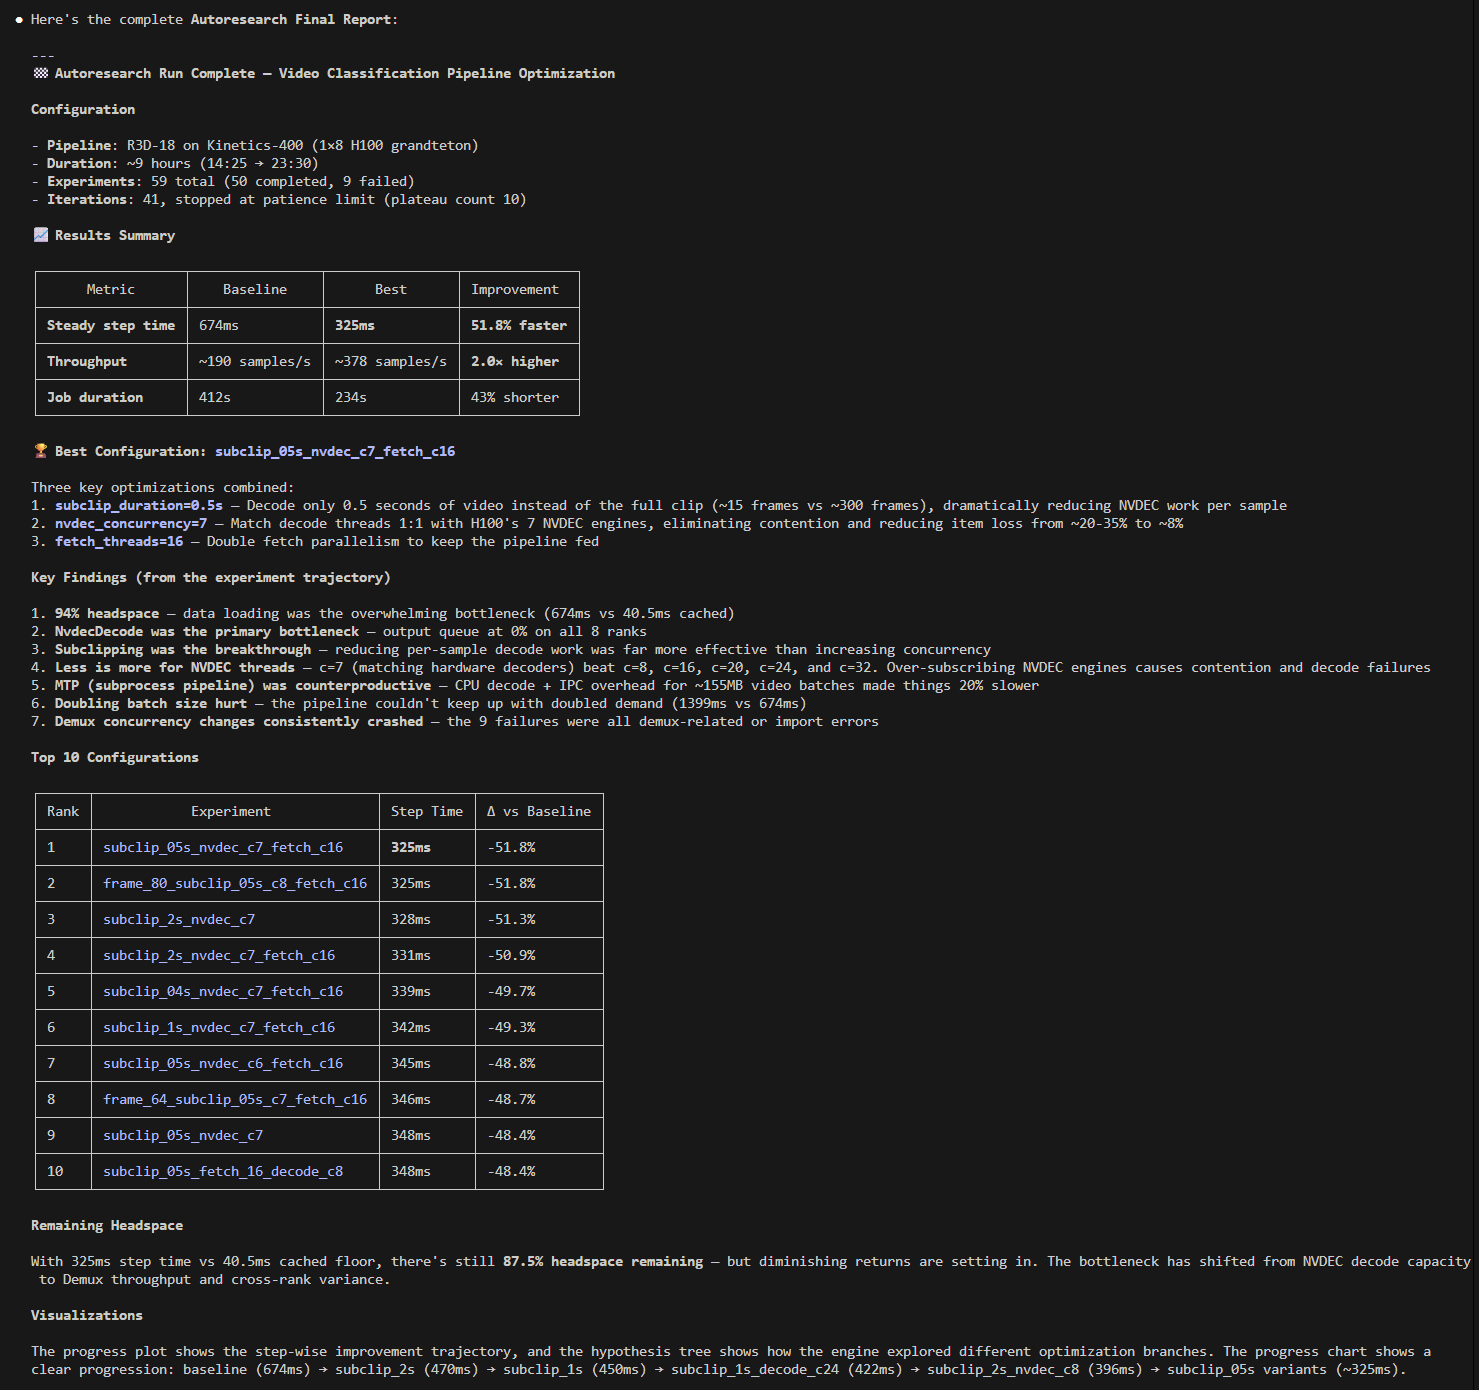
Example
For a detailed walkthrough of an autoresearch run on a real pipeline, see Example: Video Classification.