Note
Go to the end to download the full example code.
Anatomy of a Study
Understand what a Study contains: timelines, events, per-type columns, and how to compose studies with transforms into a reusable pipeline.
Continue from: Fetch Your First Study
Setup
import neuralset as ns

data_folder = ns.CACHE_FOLDER
Timelines
A Study yields timelines — each represents one recording session.
study = ns.Study(name="Fake2025Meg", path=data_folder, infra_timelines={"cluster": None})

for tl in study.iter_timelines():
    print(tl)  # dict: {subject: "sample0"}, {subject: "sample1"}
{'subject': 'sample0'}
{'subject': 'sample1'}
Events DataFrame
study.run() returns a DataFrame with all events across timelines.
  0%|          | 0/2 [00:00<?, ?it/s]
 50%|█████     | 1/2 [00:00<00:00,  3.21it/s]
100%|██████████| 2/2 [00:00<00:00,  3.21it/s]
100%|██████████| 2/2 [00:00<00:00,  3.21it/s]
Columns: ['type', 'start', 'duration', 'timeline', 'subject', 'session', 'task', 'run', 'filepath', 'start_idx', 'duration_idx', 'trigger', 'code', 'modality', 'side', 'description', 'text', 'language', 'context', 'sentence', 'sentence_char', 'frequency', 'caption', 'offset', 'study', 'stop']
Event types: ['Meg', 'Text', 'Audio', 'Sentence', 'Word', 'Stimulus', 'Image']
Timelines: 2
Inspect event types
--- Meg (2 events) ---
         start    duration text                                                                                  filepath
0    42.955971  277.715346  NaN  /home/runner/.cache/neuralset/MNE-sample-data/MEG/sample/sample_audvis_filt-0-40_raw.fif
794  42.955971  277.715346  NaN  /home/runner/.cache/neuralset/MNE-sample-data/MEG/sample/sample_audvis_filt-0-40_raw.fif

--- Word (576 events) ---
       start  duration    text filepath
4  46.578924       0.2  bottom      NaN
6  47.191629       0.2    left      NaN
9  47.897572       0.2     top      NaN

--- Image (286 events) ---
        start  duration text                                                                      filepath
7   47.191629       0.2  NaN   /home/runner/.cache/neuralset/MNE-sample-data/fake-data/fake-left-image.png
12  48.643475       0.2  NaN   /home/runner/.cache/neuralset/MNE-sample-data/fake-data/fake-left-image.png
18  49.988762       0.2  NaN  /home/runner/.cache/neuralset/MNE-sample-data/fake-data/fake-right-image.png

--- Audio (2 events) ---
         start    duration text                                                                filepath
2    46.578924  210.637375  NaN  /home/runner/.cache/neuralset/MNE-sample-data/fake-data/fake-audio.wav
796  46.578924  210.637375  NaN  /home/runner/.cache/neuralset/MNE-sample-data/fake-data/fake-audio.wav
Compose with transforms
Studies are steps – combine with transforms via Chain. A list of step dicts is auto-converted to a Chain.
import pydantic


class Experiment(pydantic.BaseModel):
    study: ns.Step


study_config = {
    "name": "Fake2025Meg",
    "path": data_folder,
    "infra_timelines": {"cluster": None},
}
exp = Experiment(
    study=[
        study_config,
        {"name": "ChunkEvents", "event_type_to_chunk": "Audio", "max_duration": 5.0},
        {"name": "QueryEvents", "query": "type in ['Audio', 'Word', 'Meg']"},
    ]
)
events = exp.study.run()
print(
    f"\nAfter transforms: {len(events)} events, types: {events['type'].unique().tolist()}"
)
0%| | 0/2 [00:00<?, ?it/s]
50%|█████ | 1/2 [00:00<00:00, 3.20it/s]
100%|██████████| 2/2 [00:00<00:00, 3.19it/s]
100%|██████████| 2/2 [00:00<00:00, 3.19it/s]
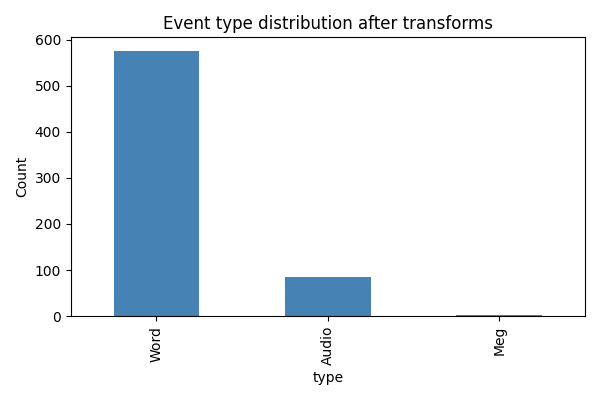
After transforms: 664 events, types: ['Meg', 'Audio', 'Word']
Visualize event distribution
import matplotlib.pyplot as plt

fig, ax = plt.subplots(figsize=(6, 4))
events["type"].value_counts().plot.bar(ax=ax, color="steelblue")
ax.set_ylabel("Count")
ax.set_title("Event type distribution after transforms")
plt.tight_layout()
plt.show()
Next steps
Creating Your Own Study — wrap your own dataset as a Study subclass.
Use the events DataFrame with
neuralsetto build a PyTorch training pipeline (see the neuralset docs).
Total running time of the script: (0 minutes 1.493 seconds)