Graphical User Interface
Introduction
This guide is for the Meta Agents Research Environments (ARE) UI, explaining the full simulation tool interface, features and components. In the ARE UI, you will be able to run different models on a fixed baseline orchestration and environment, observe agent behavior, and explore Gaia2 environments and scenarios. Reference this guide to help you understand how to get started with ARE UI.
Getting Started
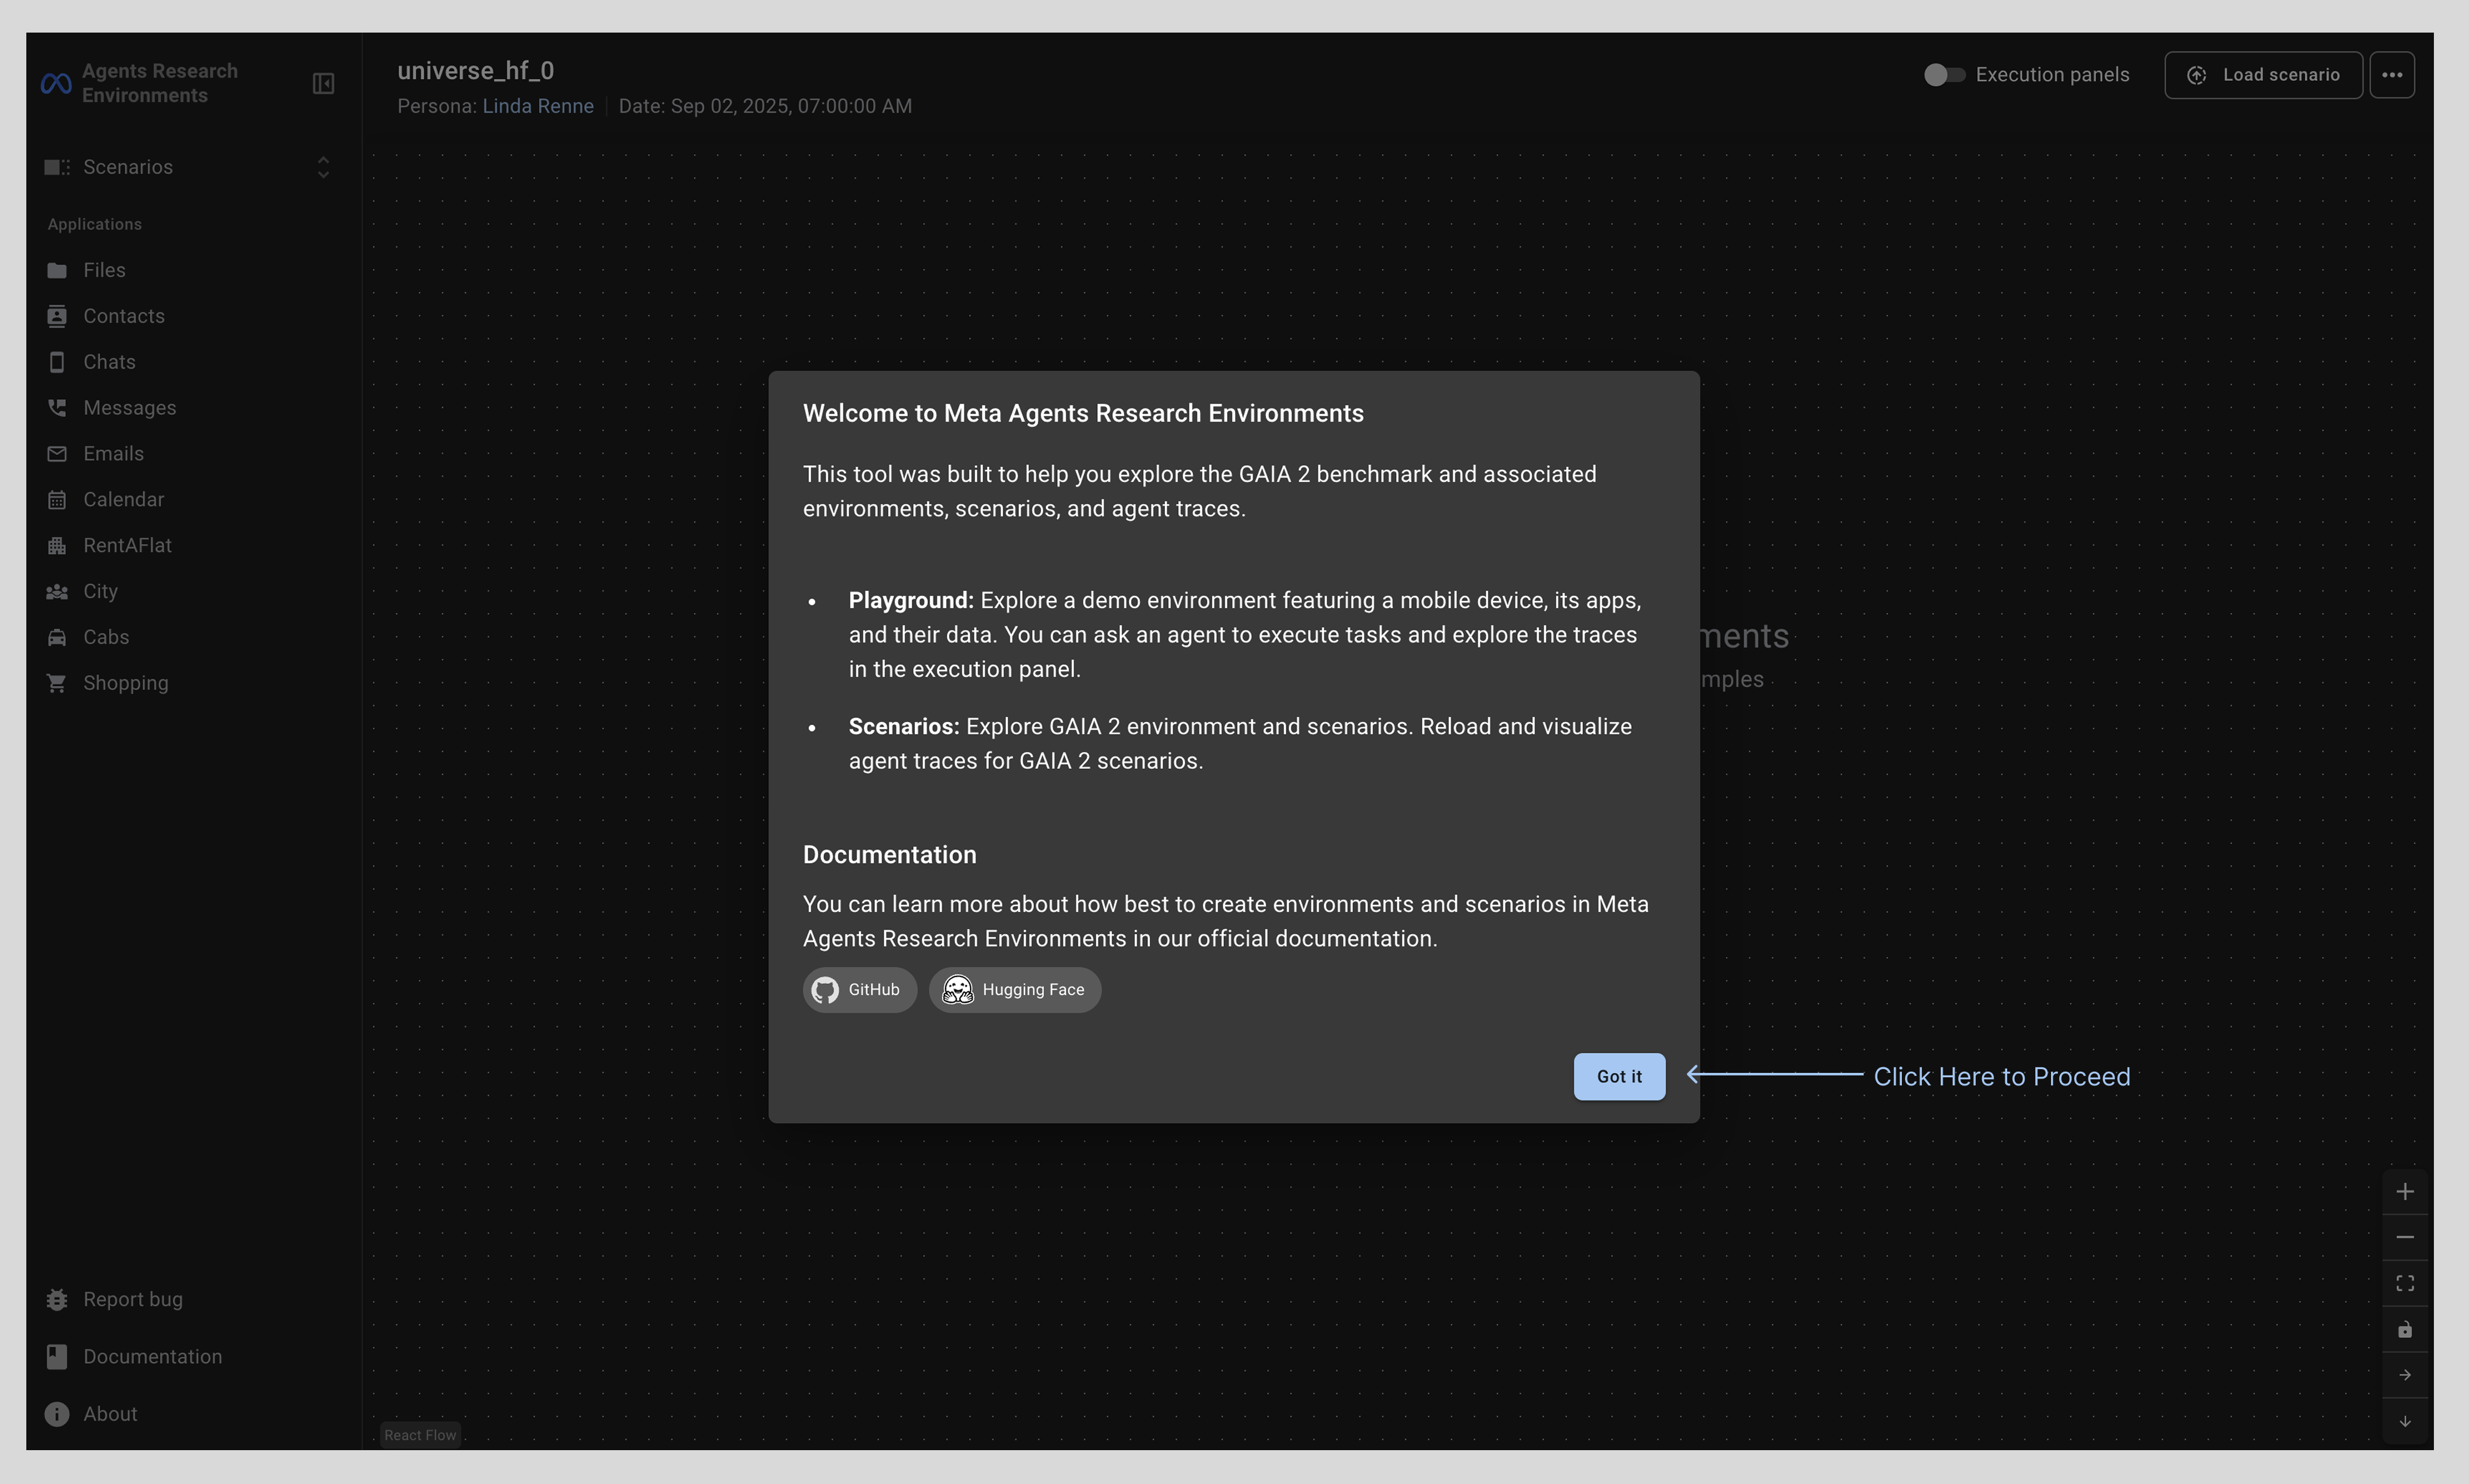
Upon entering the ARE UI, you will be greeted by an introductory screen that provides an overview explanation of the different workspaces, along with links to documentation. There are two workspaces in the ARE UI: Playground and Scenarios. See below for details on each of these workspaces. The documentation resources will help you learn more about the ARE application itself as well as the Gaia2 benchmark. You can access this screen again anytime by clicking [about] at the bottom of the left navigation pane.
Click [Got it] to proceed to the Scenario View
Navigation
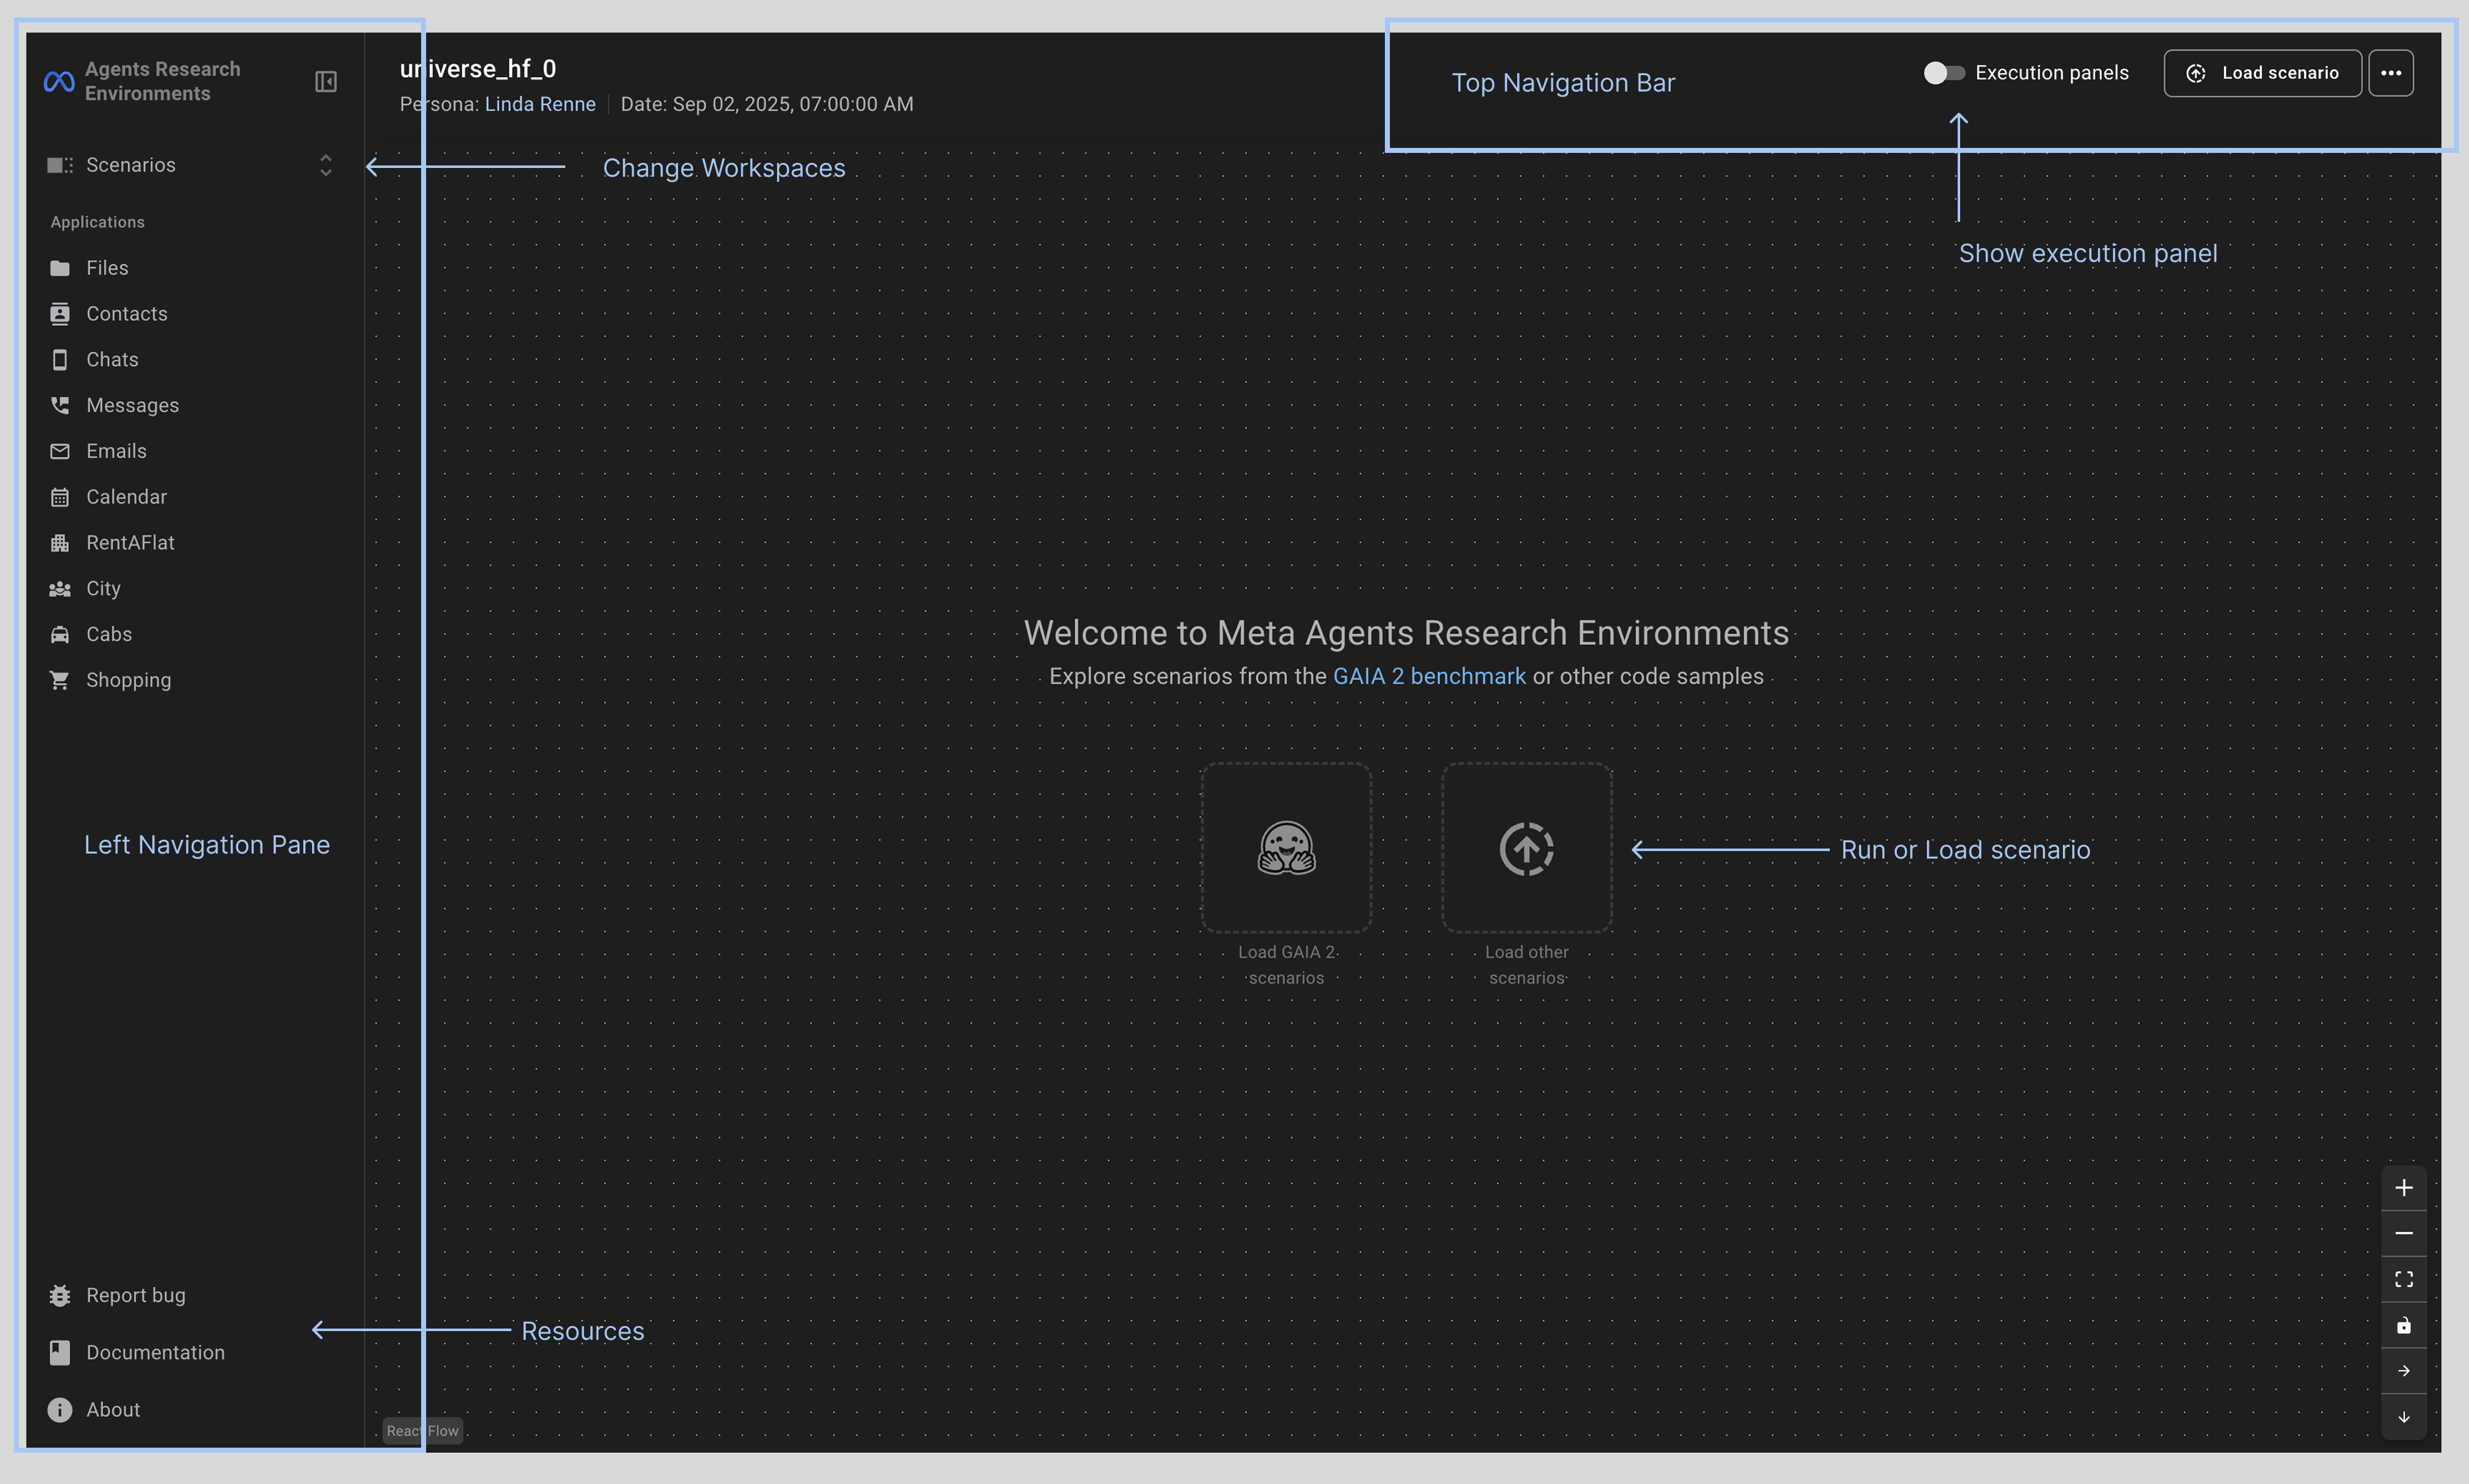
The ARE Interface is made up of two main navigation panels: a left navigation bar to switch between Scenarios and Playground views; and a top navigation bar with actions and settings related to the workspace. When you land in the ARE UI, you will start in a blank Scenarios workspace view where you can elect to turn on the execution panels from the top navigation bar before running or loading a scenario. See the Scenario workspace section for details on the top navigation functionalities.
Left Navigation Pane Details
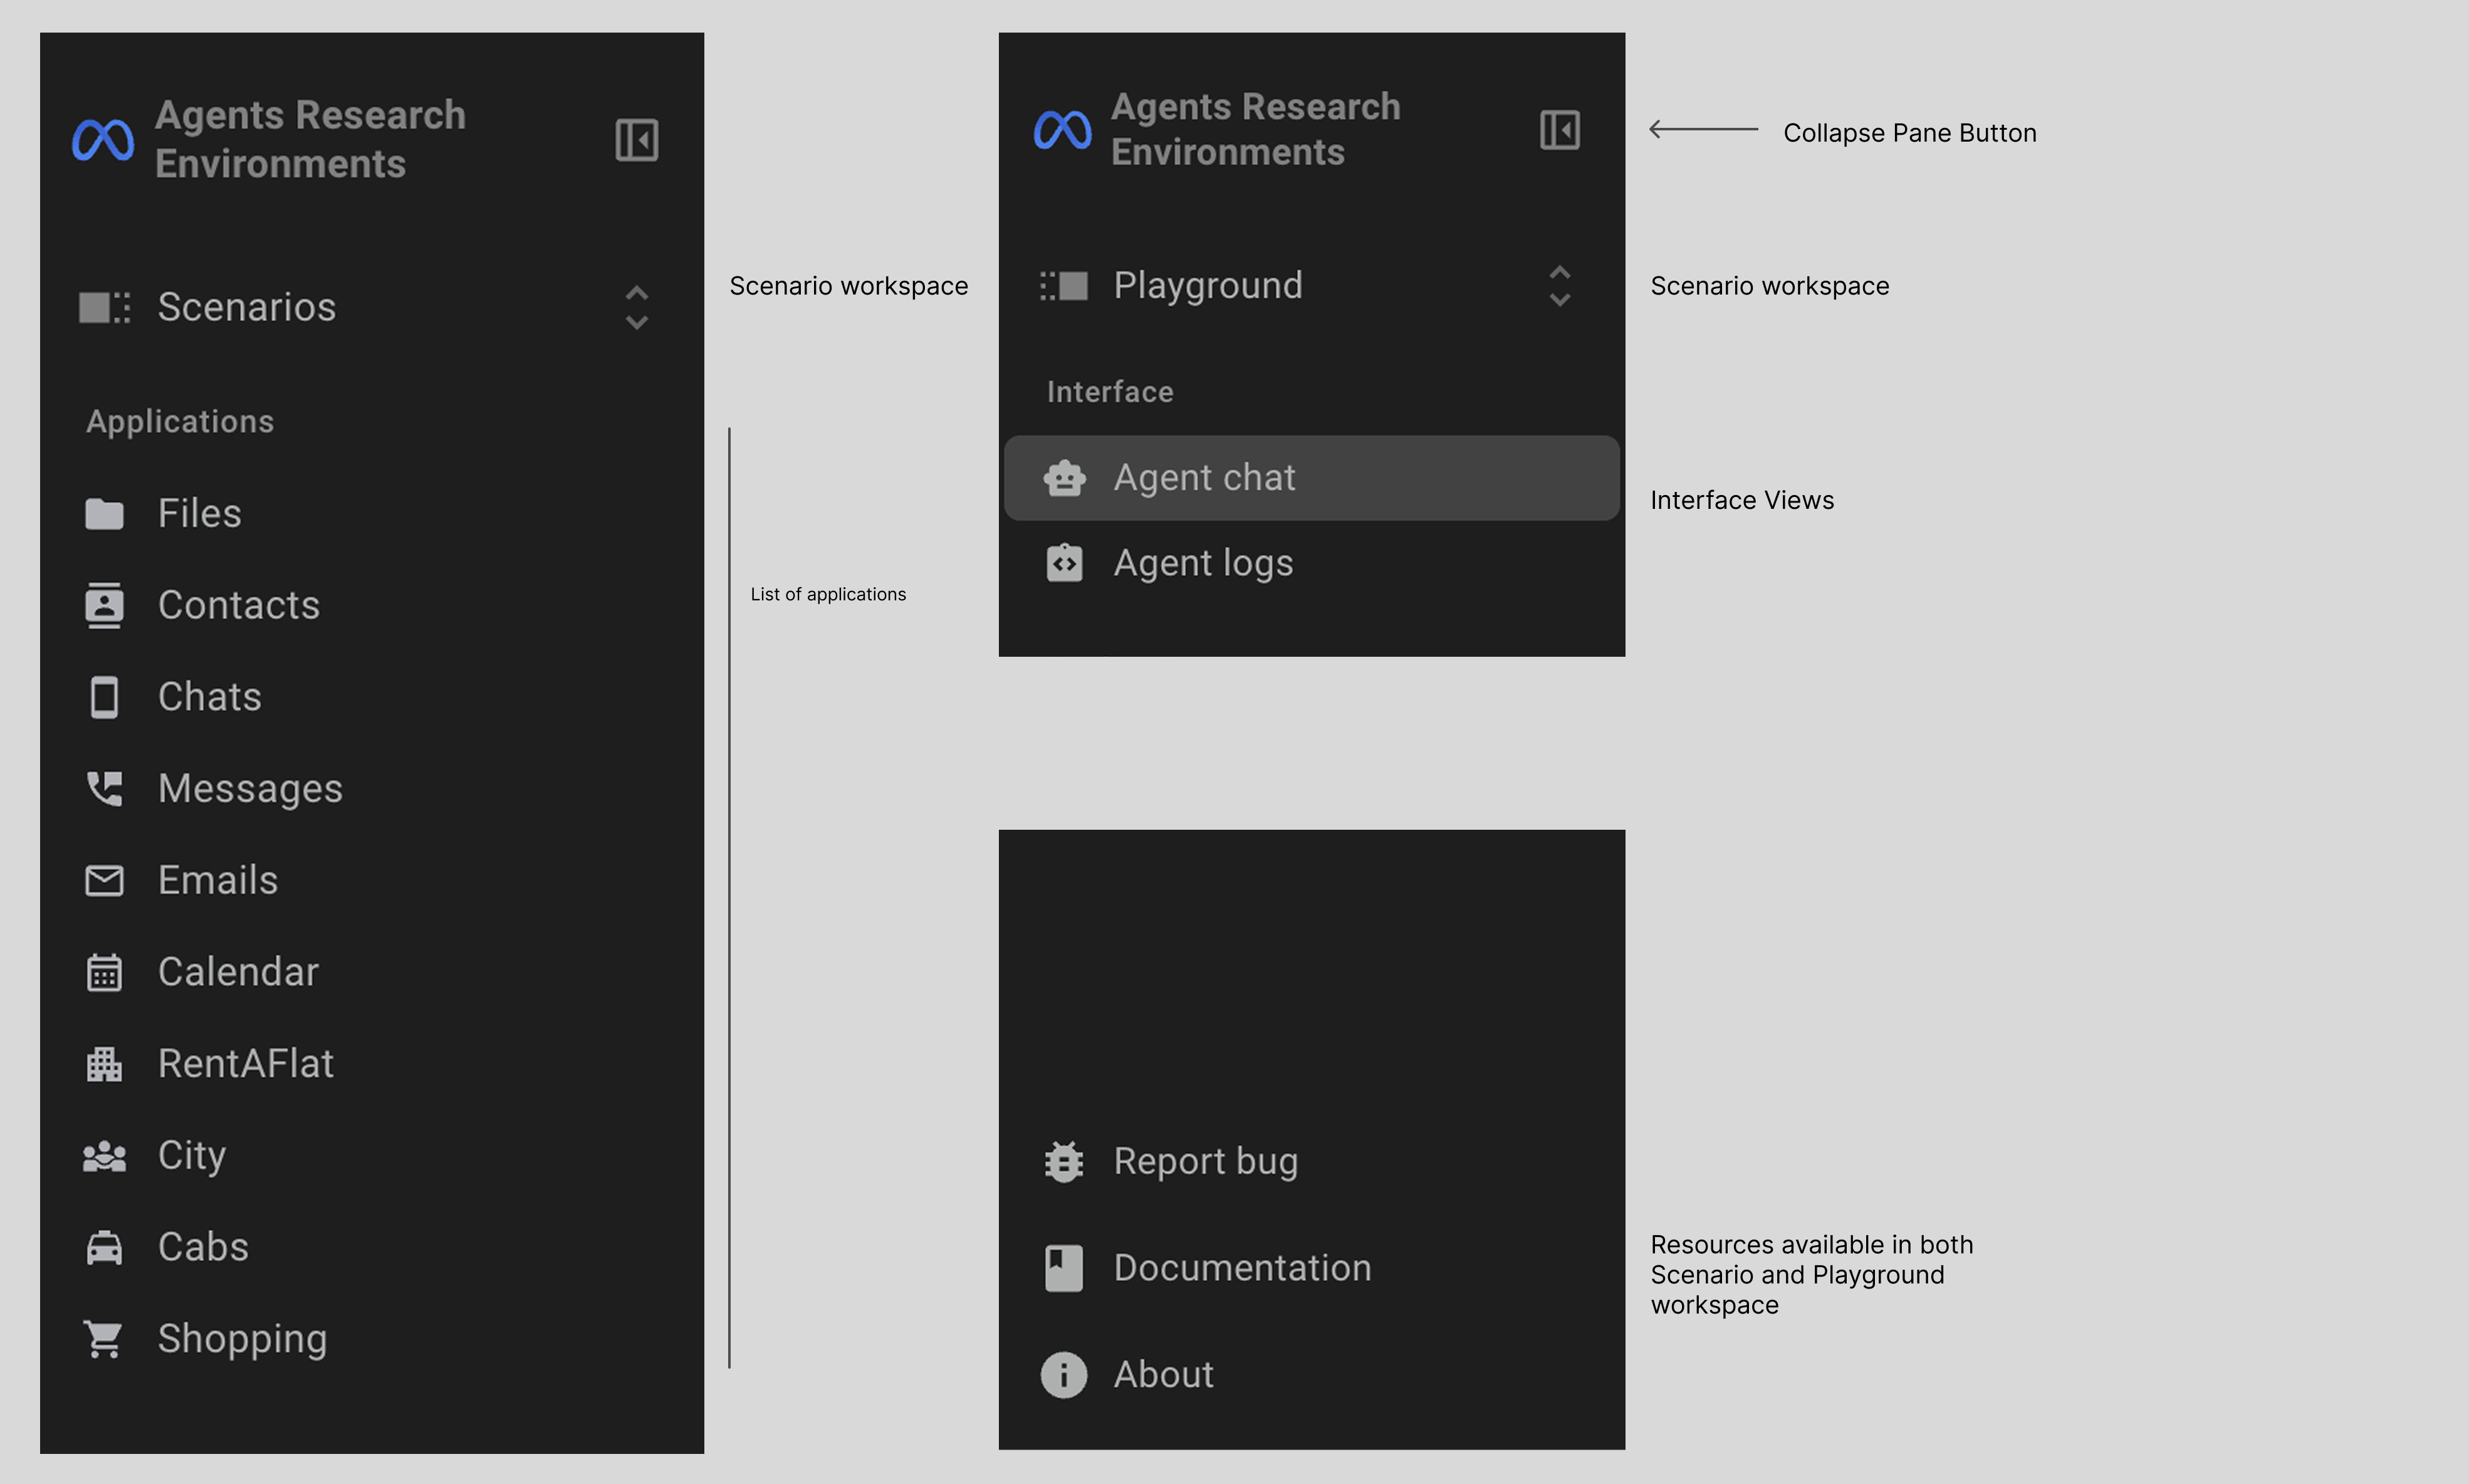
Use the left navigation pane to switch between the Scenario workspace and the Playground workspace.
Click [Scenarios] or [Playground] to change between views
Within the Playground view you will have additional interface options to engage in agent chat or view agent logs. Use the left navigation pane to select the relevant view for your workflow.
Both the Scenario and Playground views then list the simulated applications you can interface with in the Scenario or Playground workspace.
Click [Application Name] to expand a detail view with state, available tools, or calls.
There are also global resources that enable you to report a bug, access documentation or see the overview on ARE.
To create a GitHub Issue click [Report a Bug]
To access the Meta Agents Research Environments docs click [Documentation]
Scenario workspace
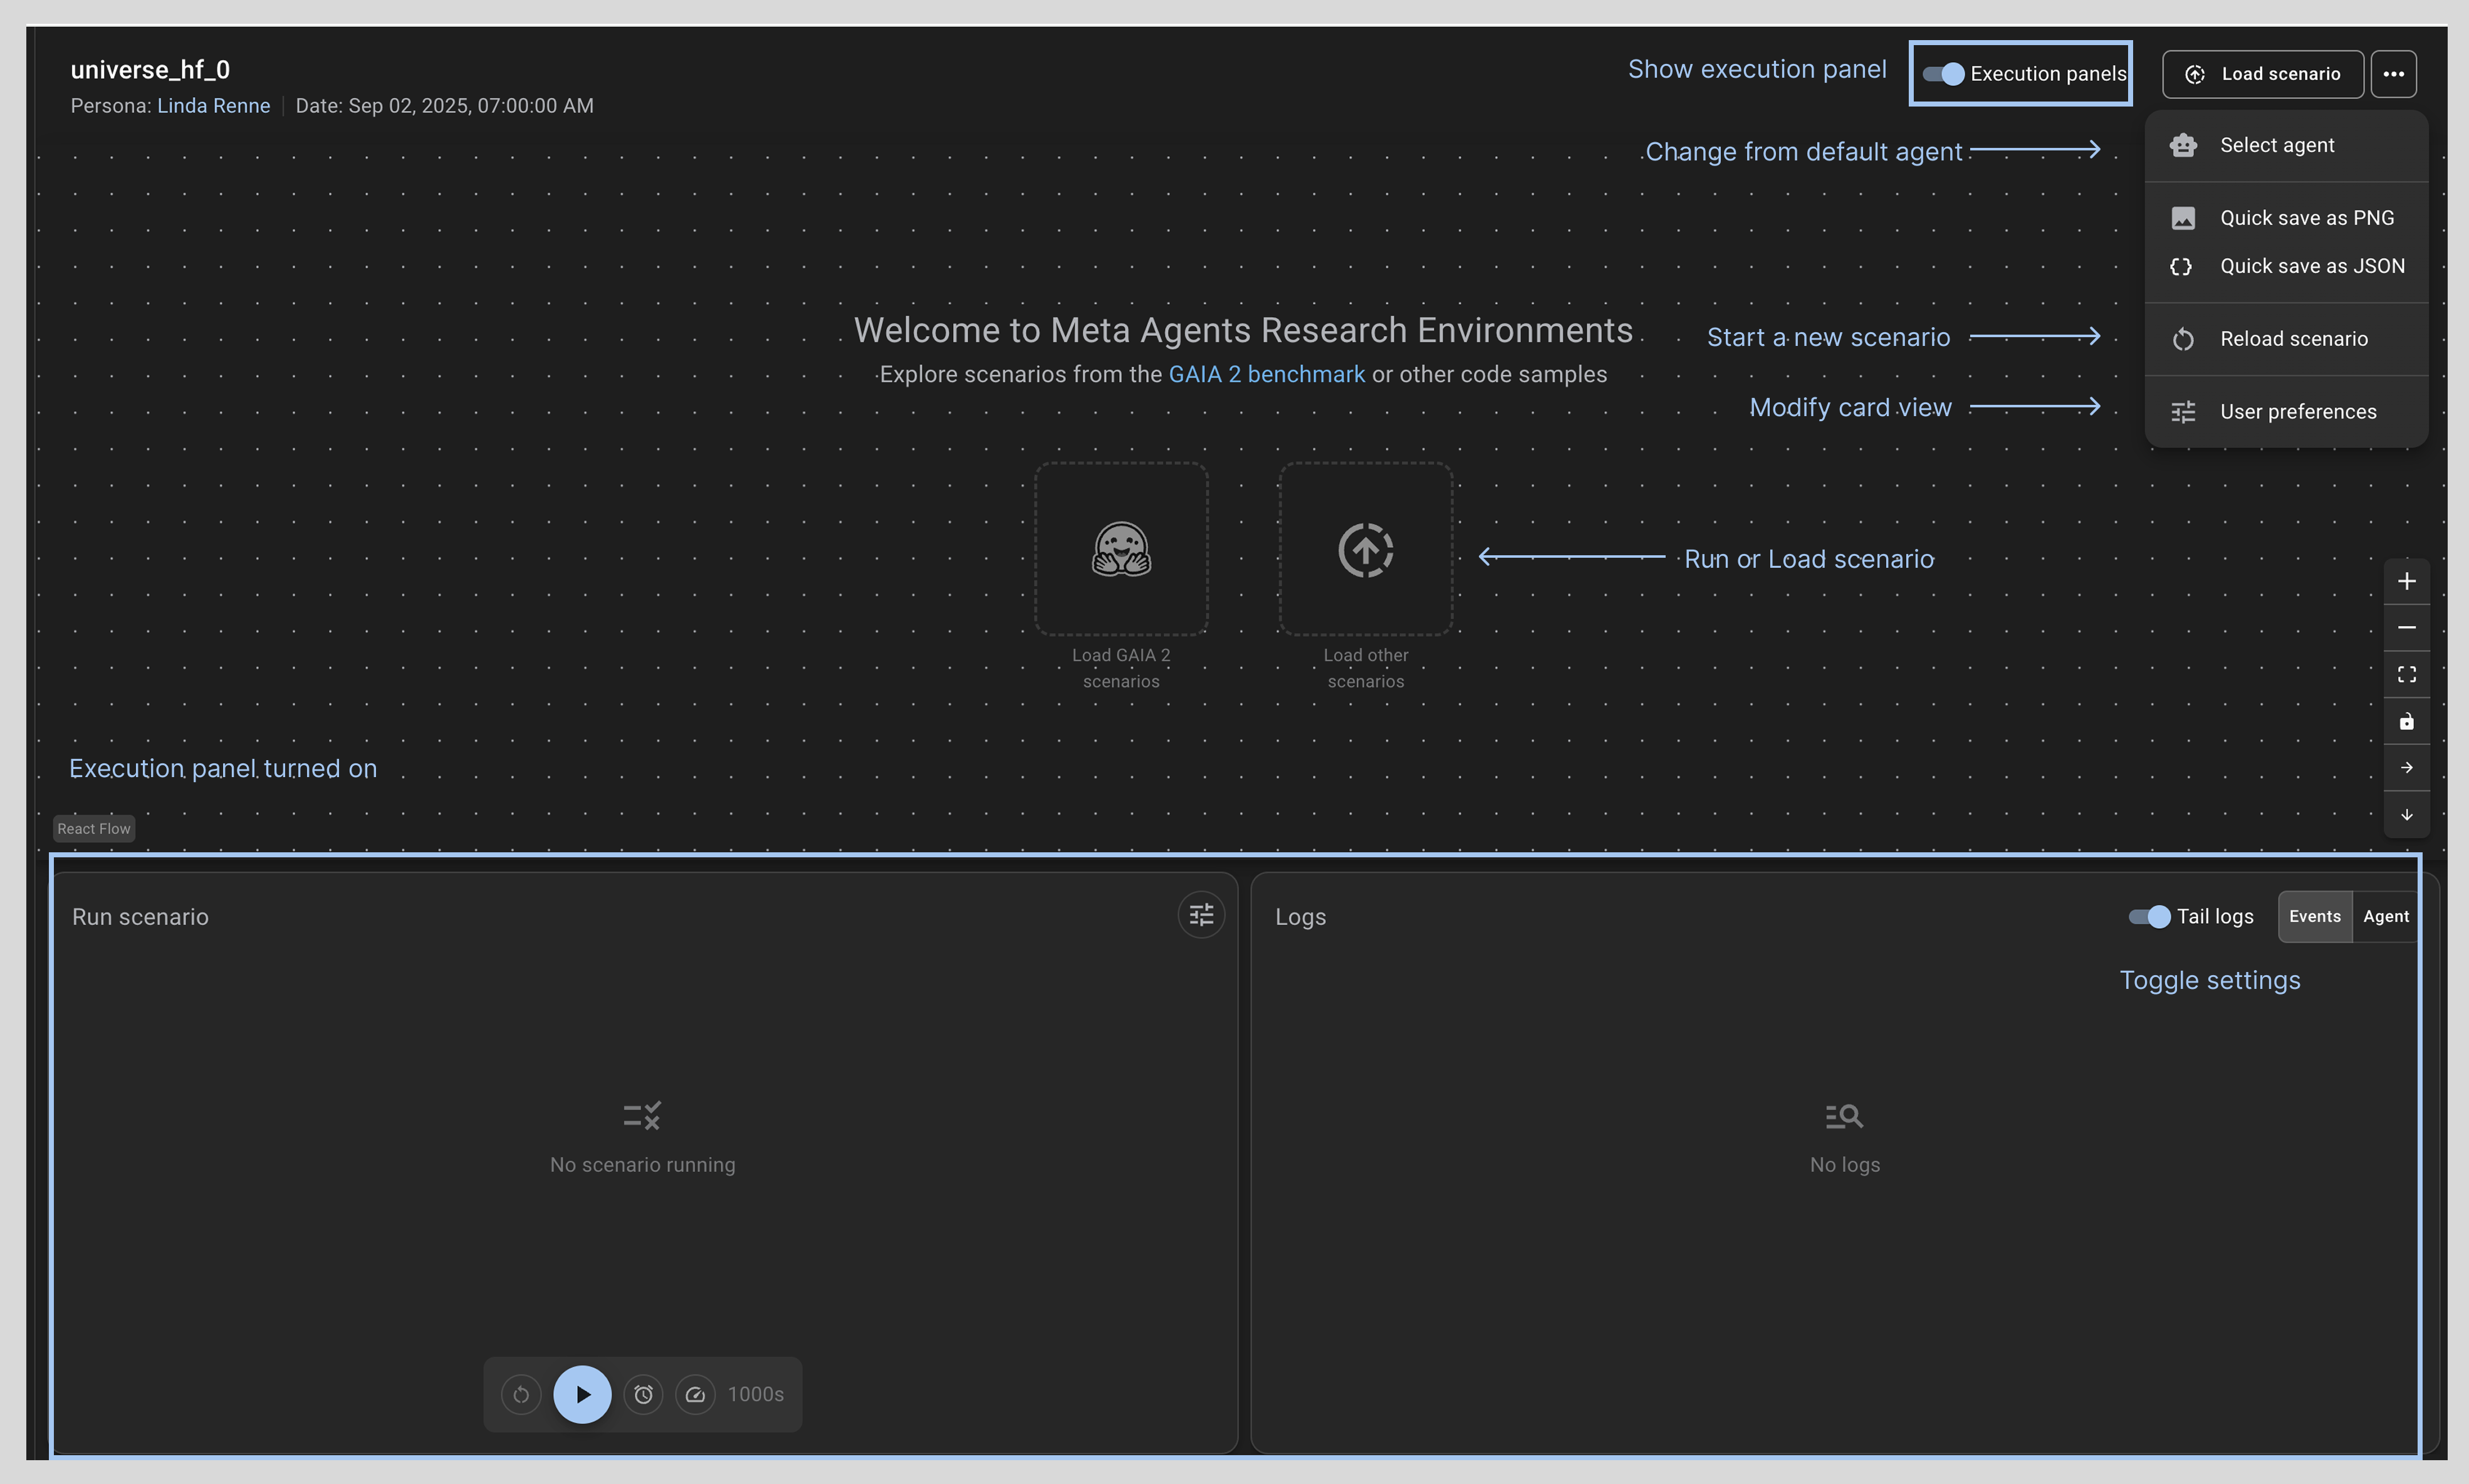
The Scenario workspace allows you to load, visualize and perform actions on ARE scenarios and the events within the scenarios. You can configure the view to your preference by leveraging the top navigation bar.
Toggle [Execution panels] if you want to view the scenario run steps and logs.
Note, when you run your first scenario the execution panel will automatically turn on, as you will then be able to pause and track the scenario.
How to run a scenario
You can load scenarios from Gaia2 dataset on Hugging Face <https://huggingface.co/datasets/meta-agents-research-environments/gaia2> or load other demo scenarios from the Scenario workspace. Use the buttons in the center frame or select load scenario from the top navigation bar.
For scenarios from the Gaia2 benchmark
Click on the [Hugging Face] button in the center frame or select [Hugging Face] from the drop down menu in the top navigation bar.
You will see a pop up window to make three selections: capability, split (always validation) and scenario.
Make your selections then click [confirm]
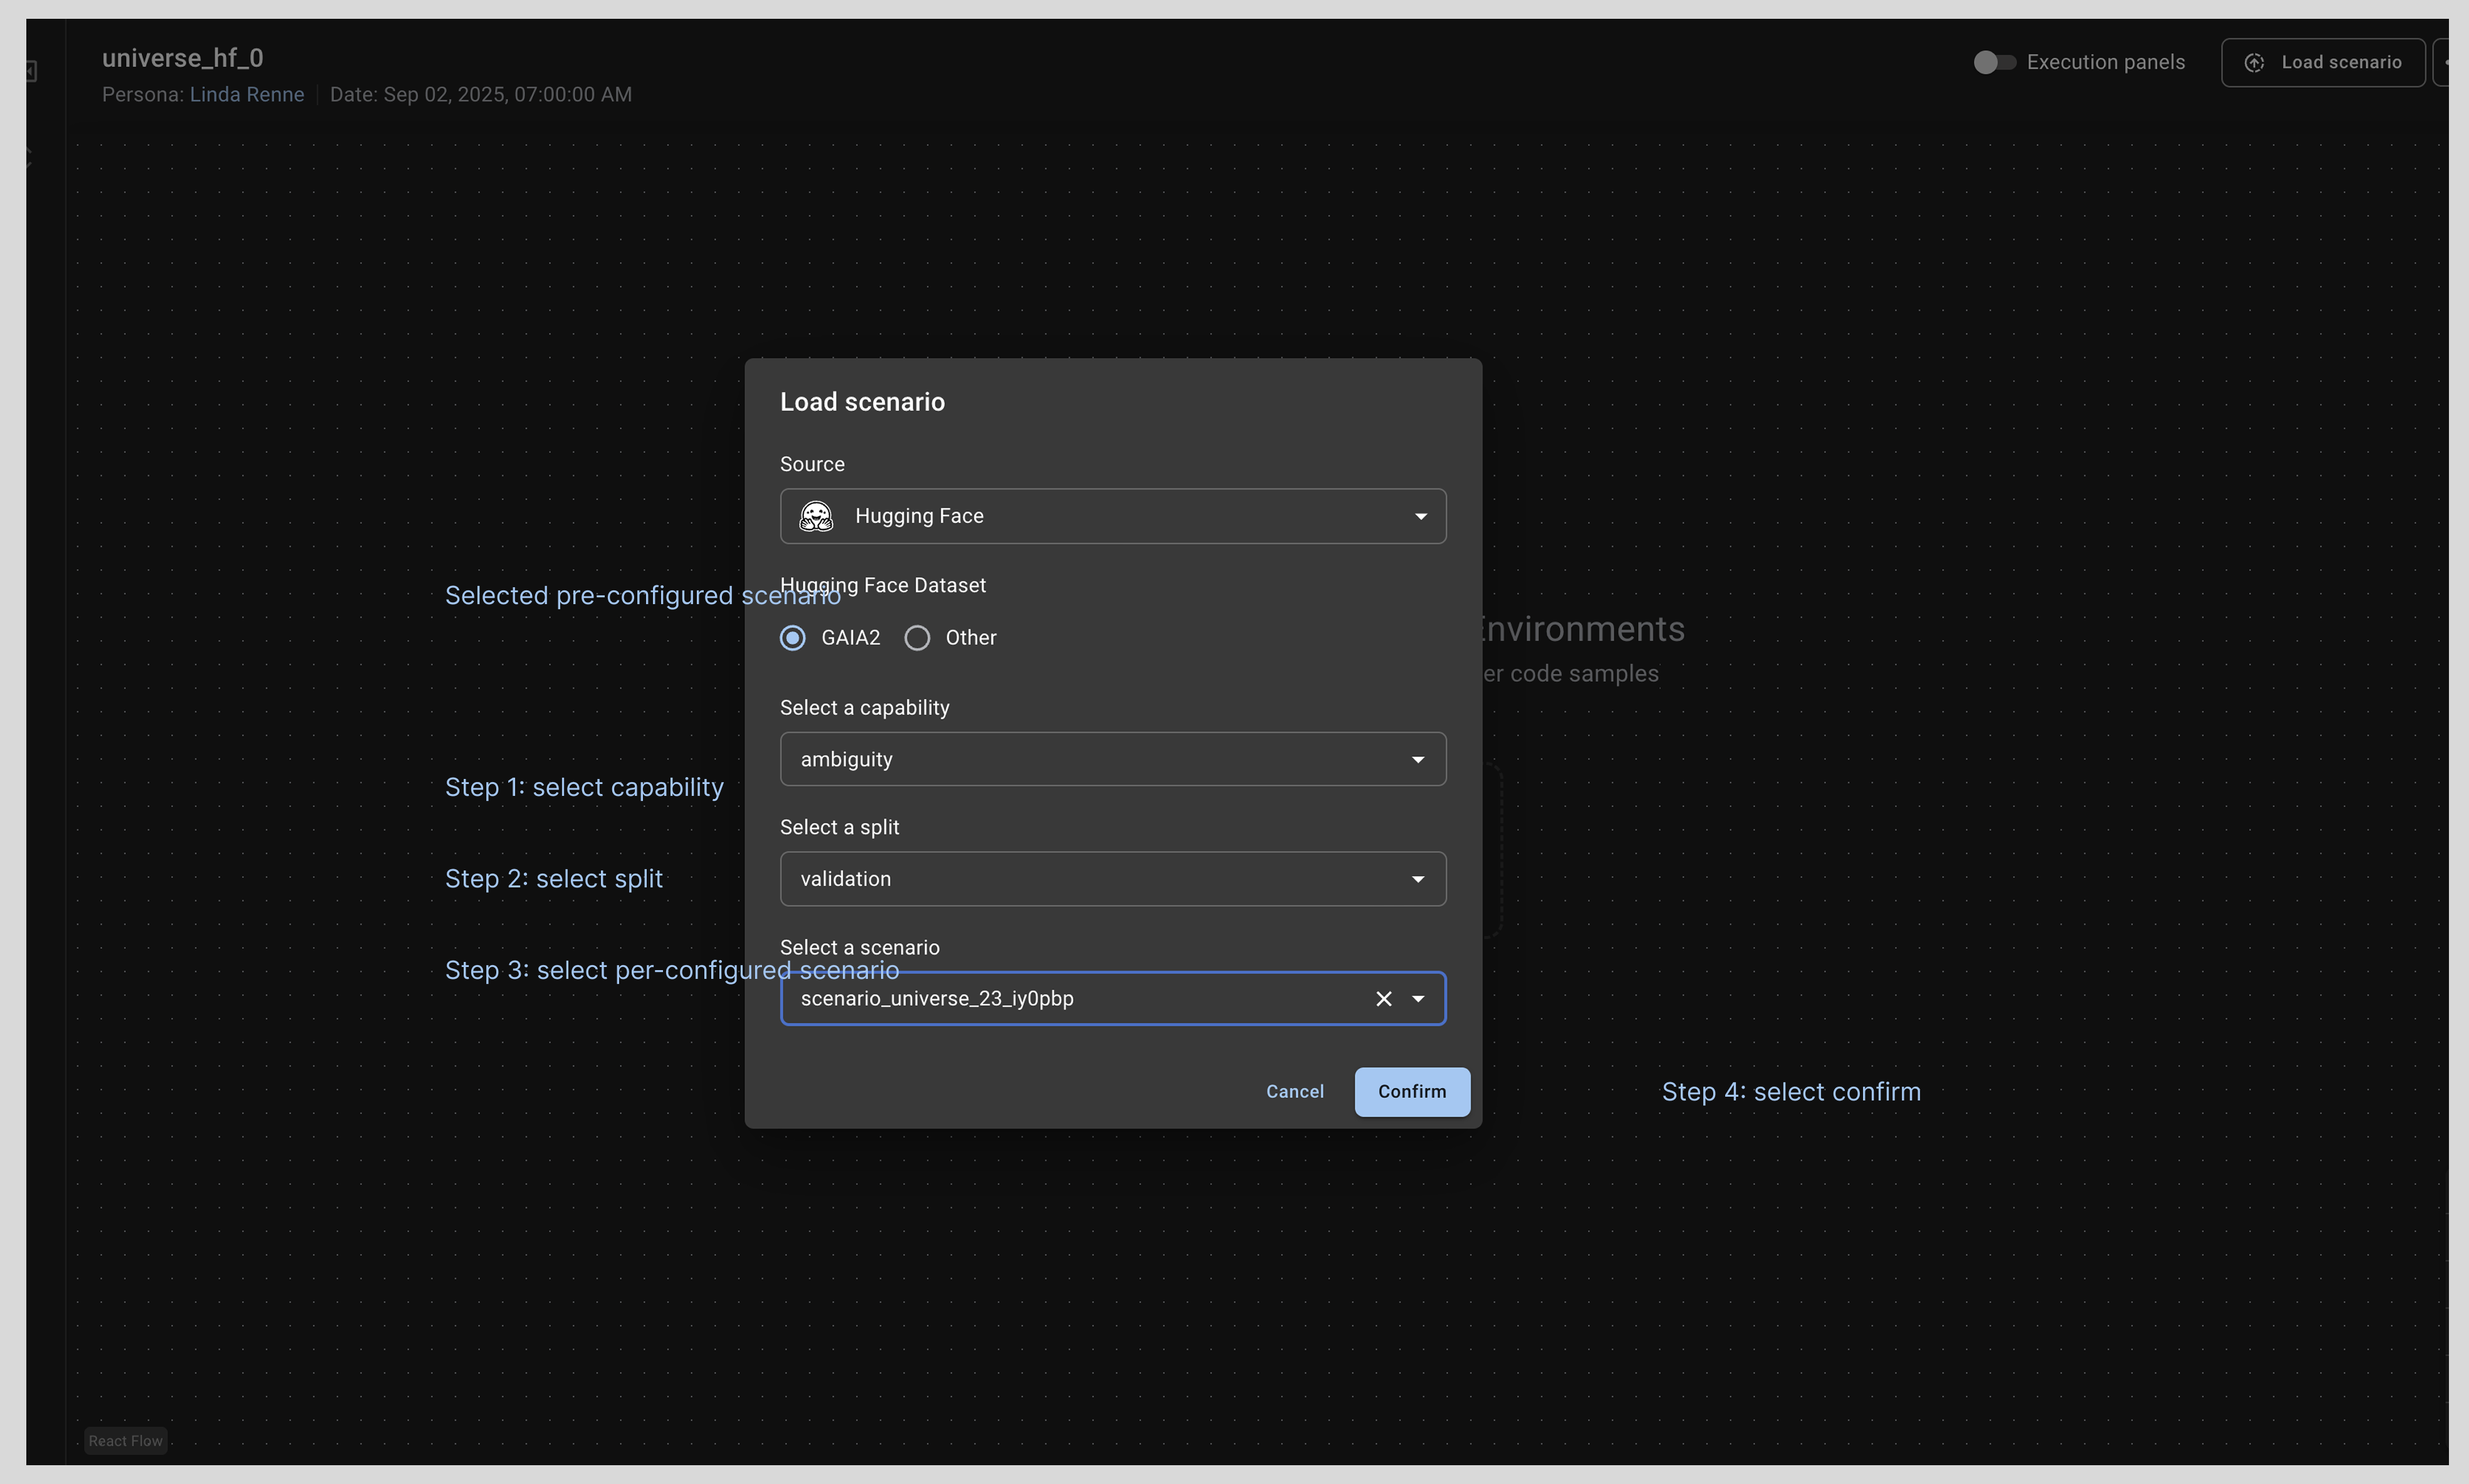
Once you have confirmed your scenario settings, ARE will load the scenario from the Gaia2 benchmark, which will appear in the top half of the frame as a Direct Acyclic Graph (DAG) of the agentic trajectories. Note, some scenarios will not contain scheduled events so will not render a DAG.
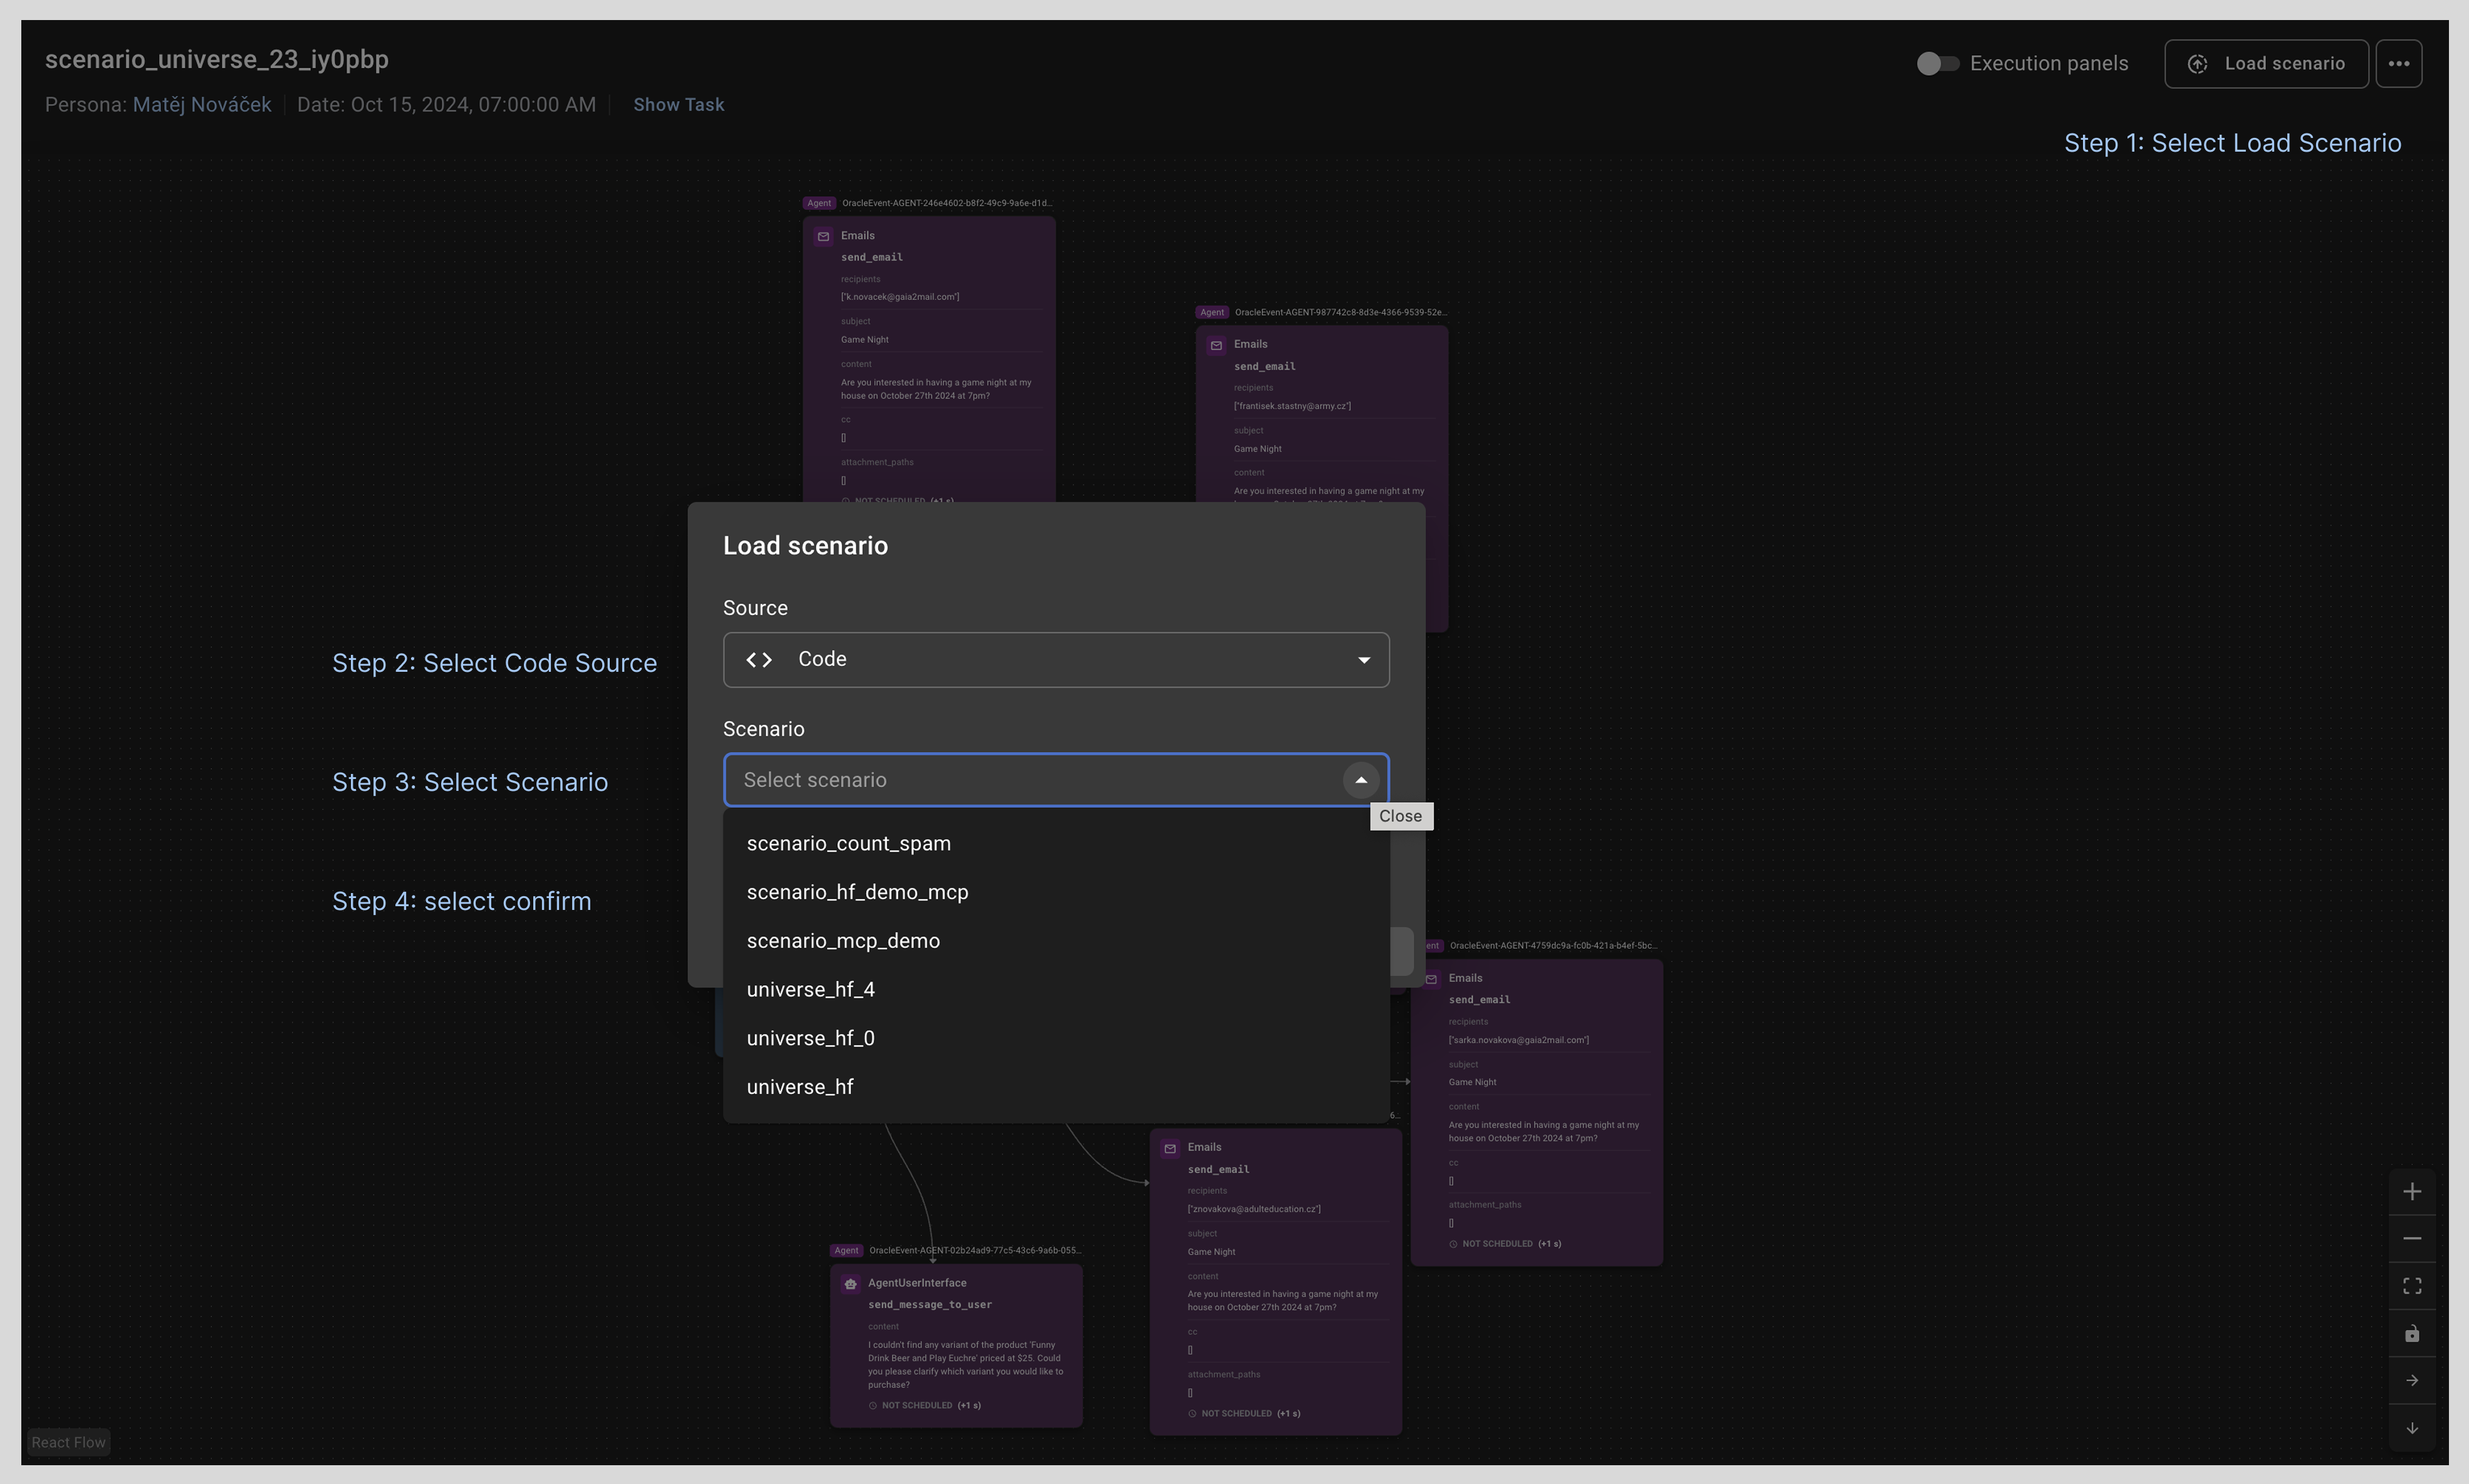
For python scenarios from the codebase
Select [Load scenario] from the drop down menu in the top navigation bar.
You will see a pop up window to confirm source: code and make your scenario selection.
Make your selections then click [confirm]. Again once selecting confirm ARE will run the scenario.
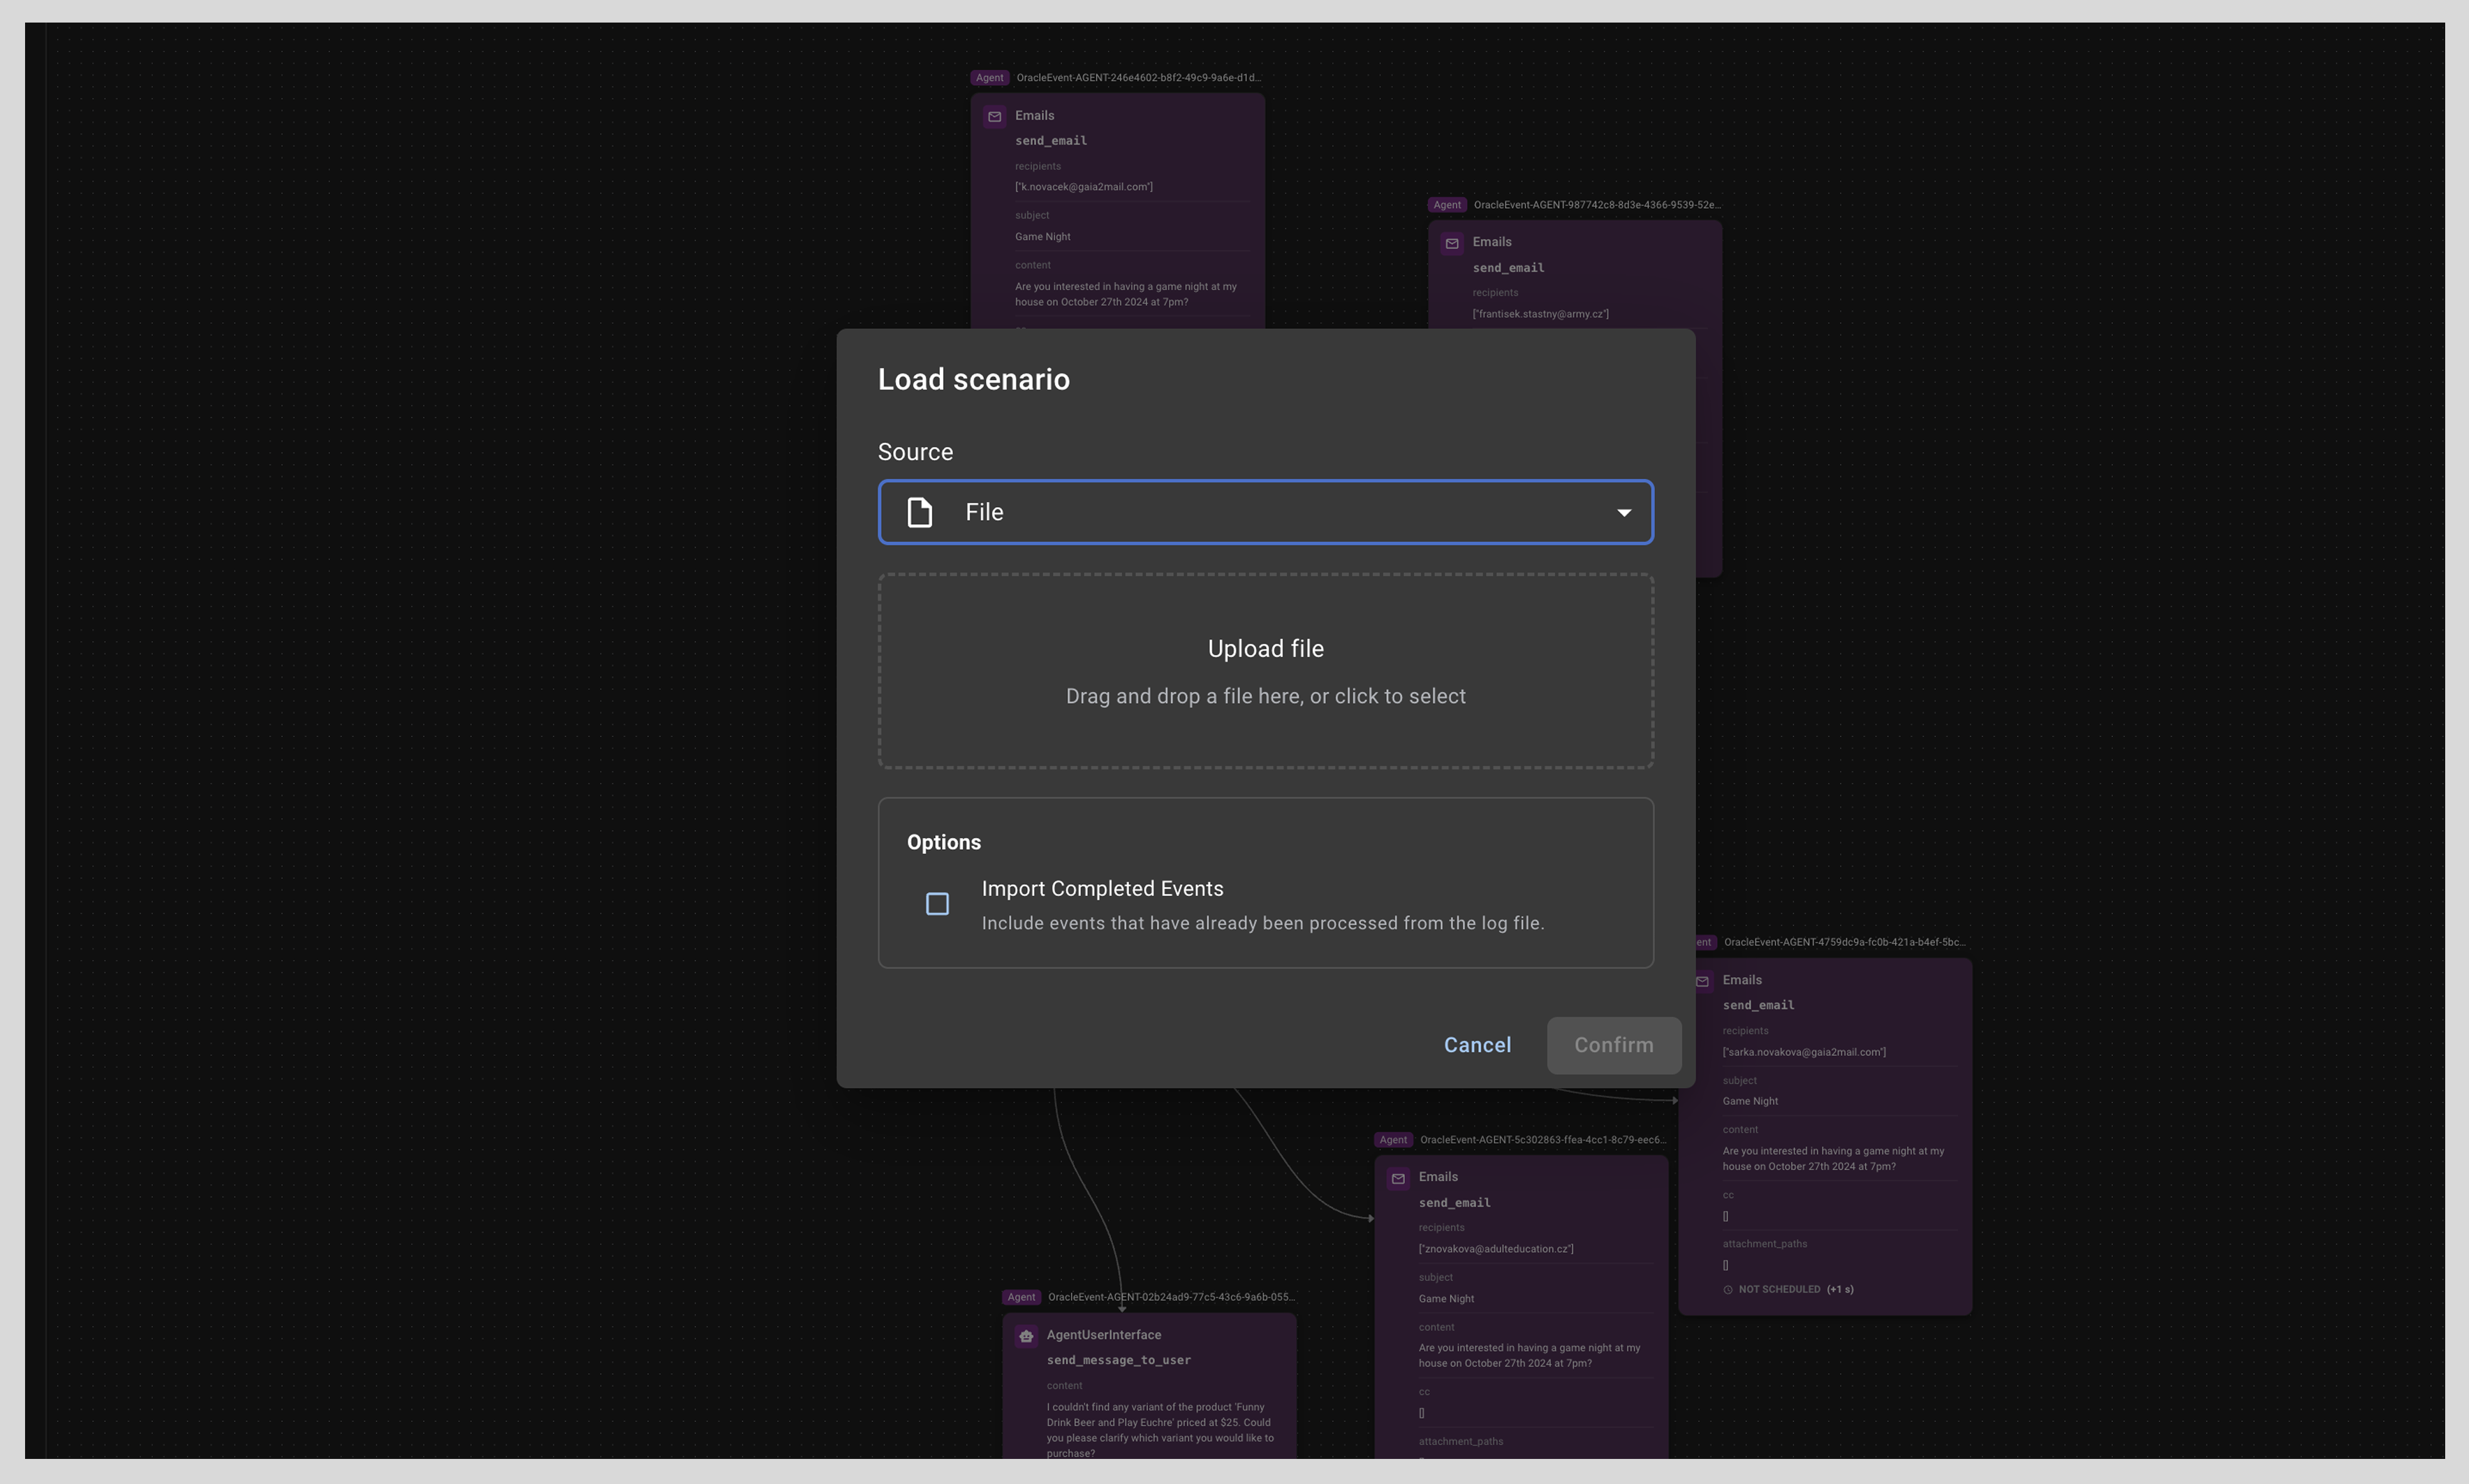
For any scenario
You also have the option to upload a json file or direct to a URL from the Load scenario menu.
Click on the [Upload] button in the center frame or select [File] or [URL] from the drop down menu in the top navigation bar.
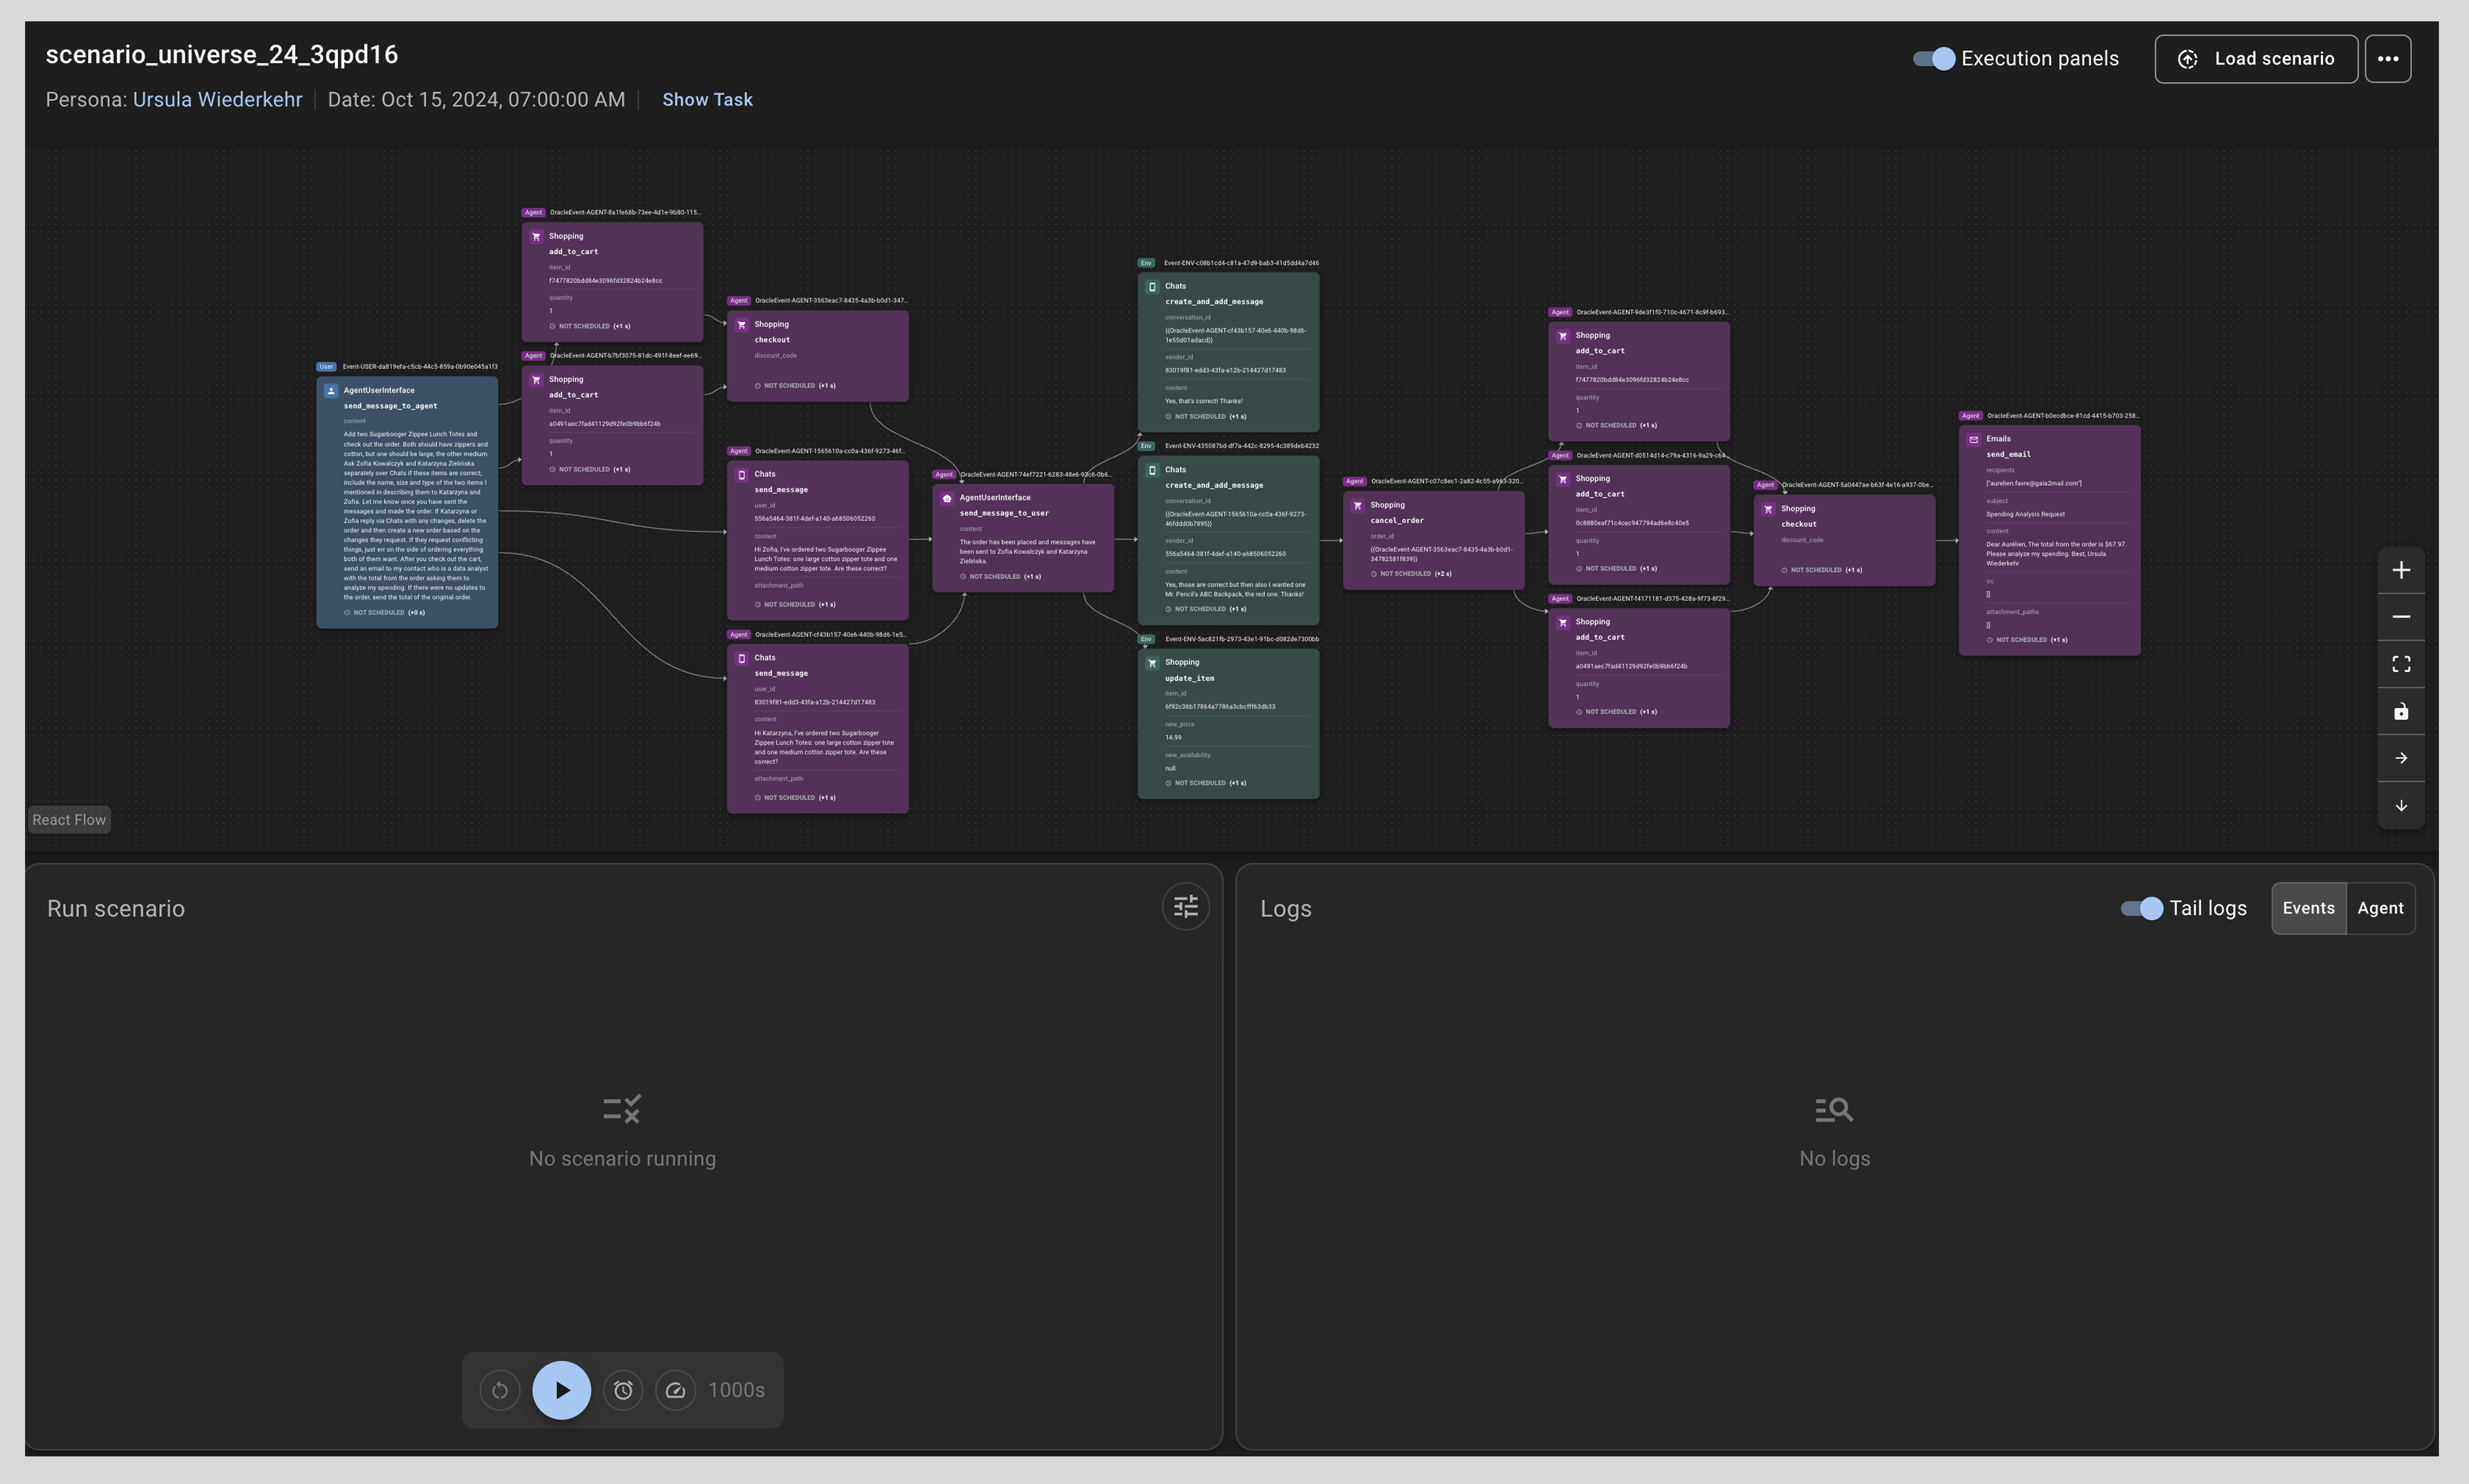
Scenario Visualization
Loaded scenarios display in the top frame of the Scenario workspace as a Direct Acyclic Graph (DAG) of events, and are color-coded by origin:
Blue: User action
Pink: Agent action
Green: Environment event (e.g., incoming email)
The below image is an example of a Scenarios view where all origins and scheduled events are present. Use this view for running and analyzing predefined agent trajectories.
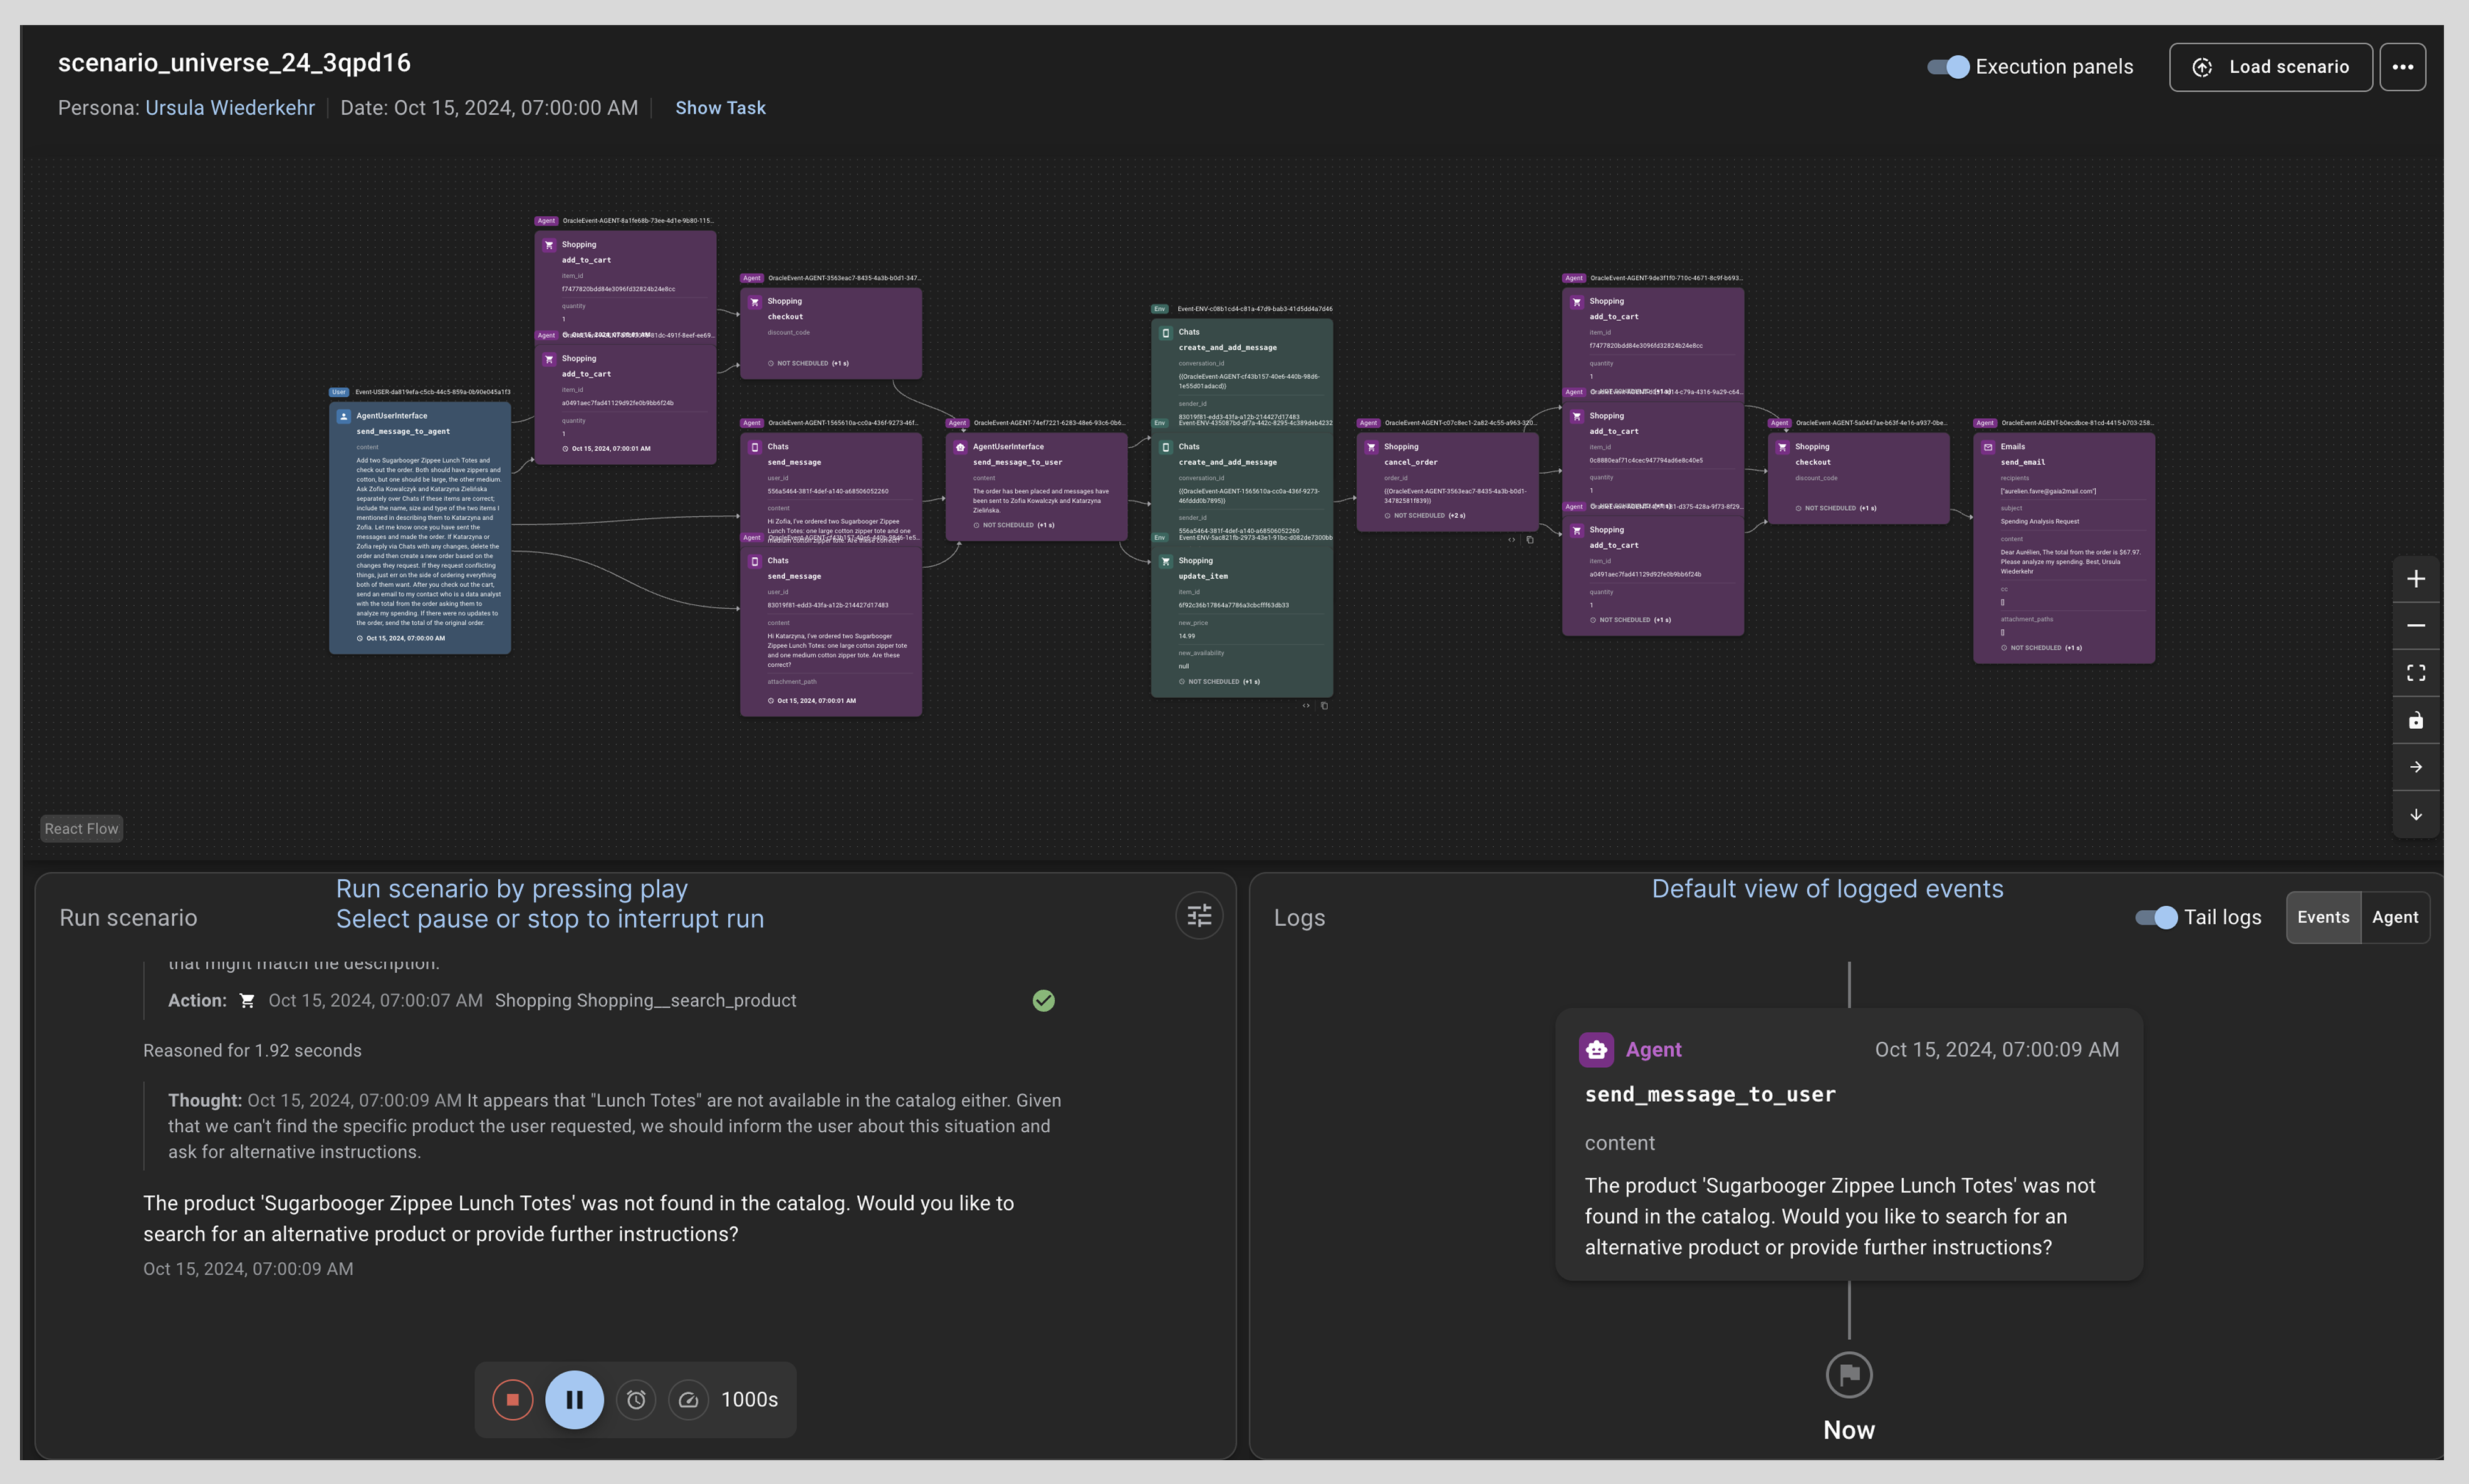
Executing and Monitoring Scenario
After reviewing the scenario, ensure your execution panel is on and click on the [Play] button. This will start the execution from a clean simulated state.
In the left pane you can monitor the reasoning traces. In the right pane you can monitor the visual timeline of events. At any time you can stop or pause the simulation by using the controls in the left pane. In the control panel you can track total run duration before auto-stop and time increments between simulation ticks.
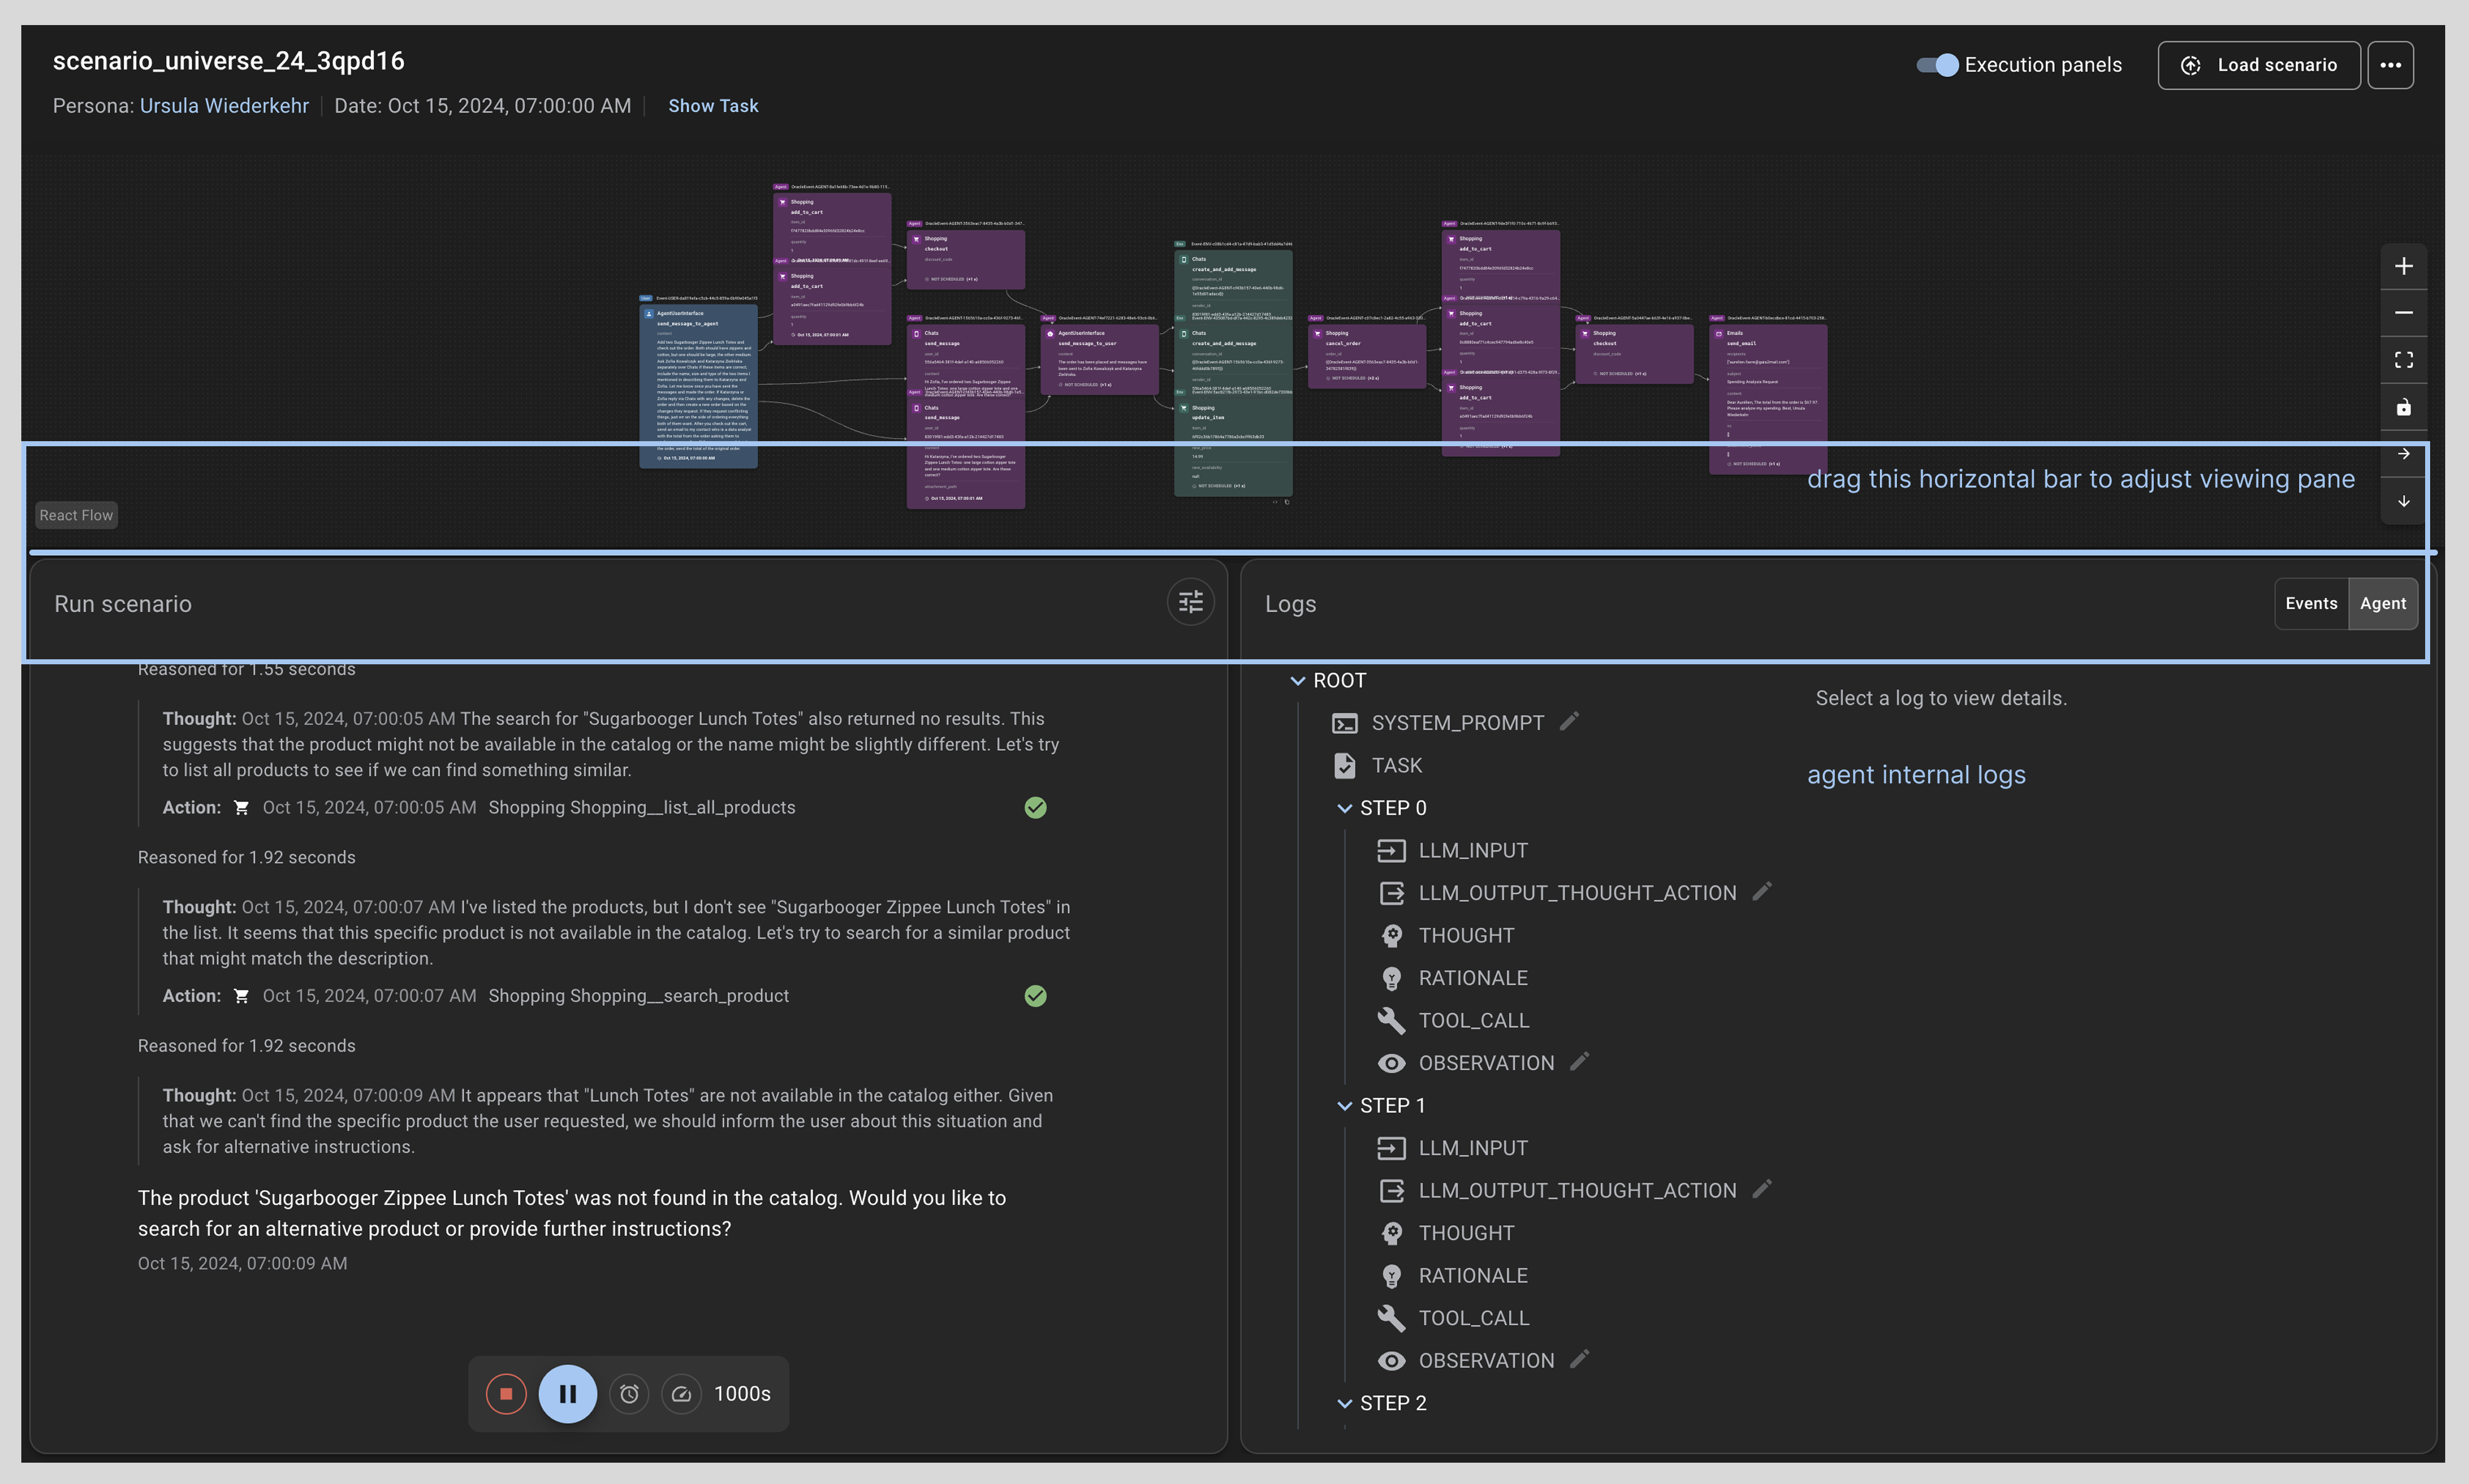
You can also change your monitoring view by clicking on the [Agent] toggle, which will show you detailed agent internal logs. Consider readjusting the height of your Scenario view by dragging the horizontal bar between the scenario view and scenario run.
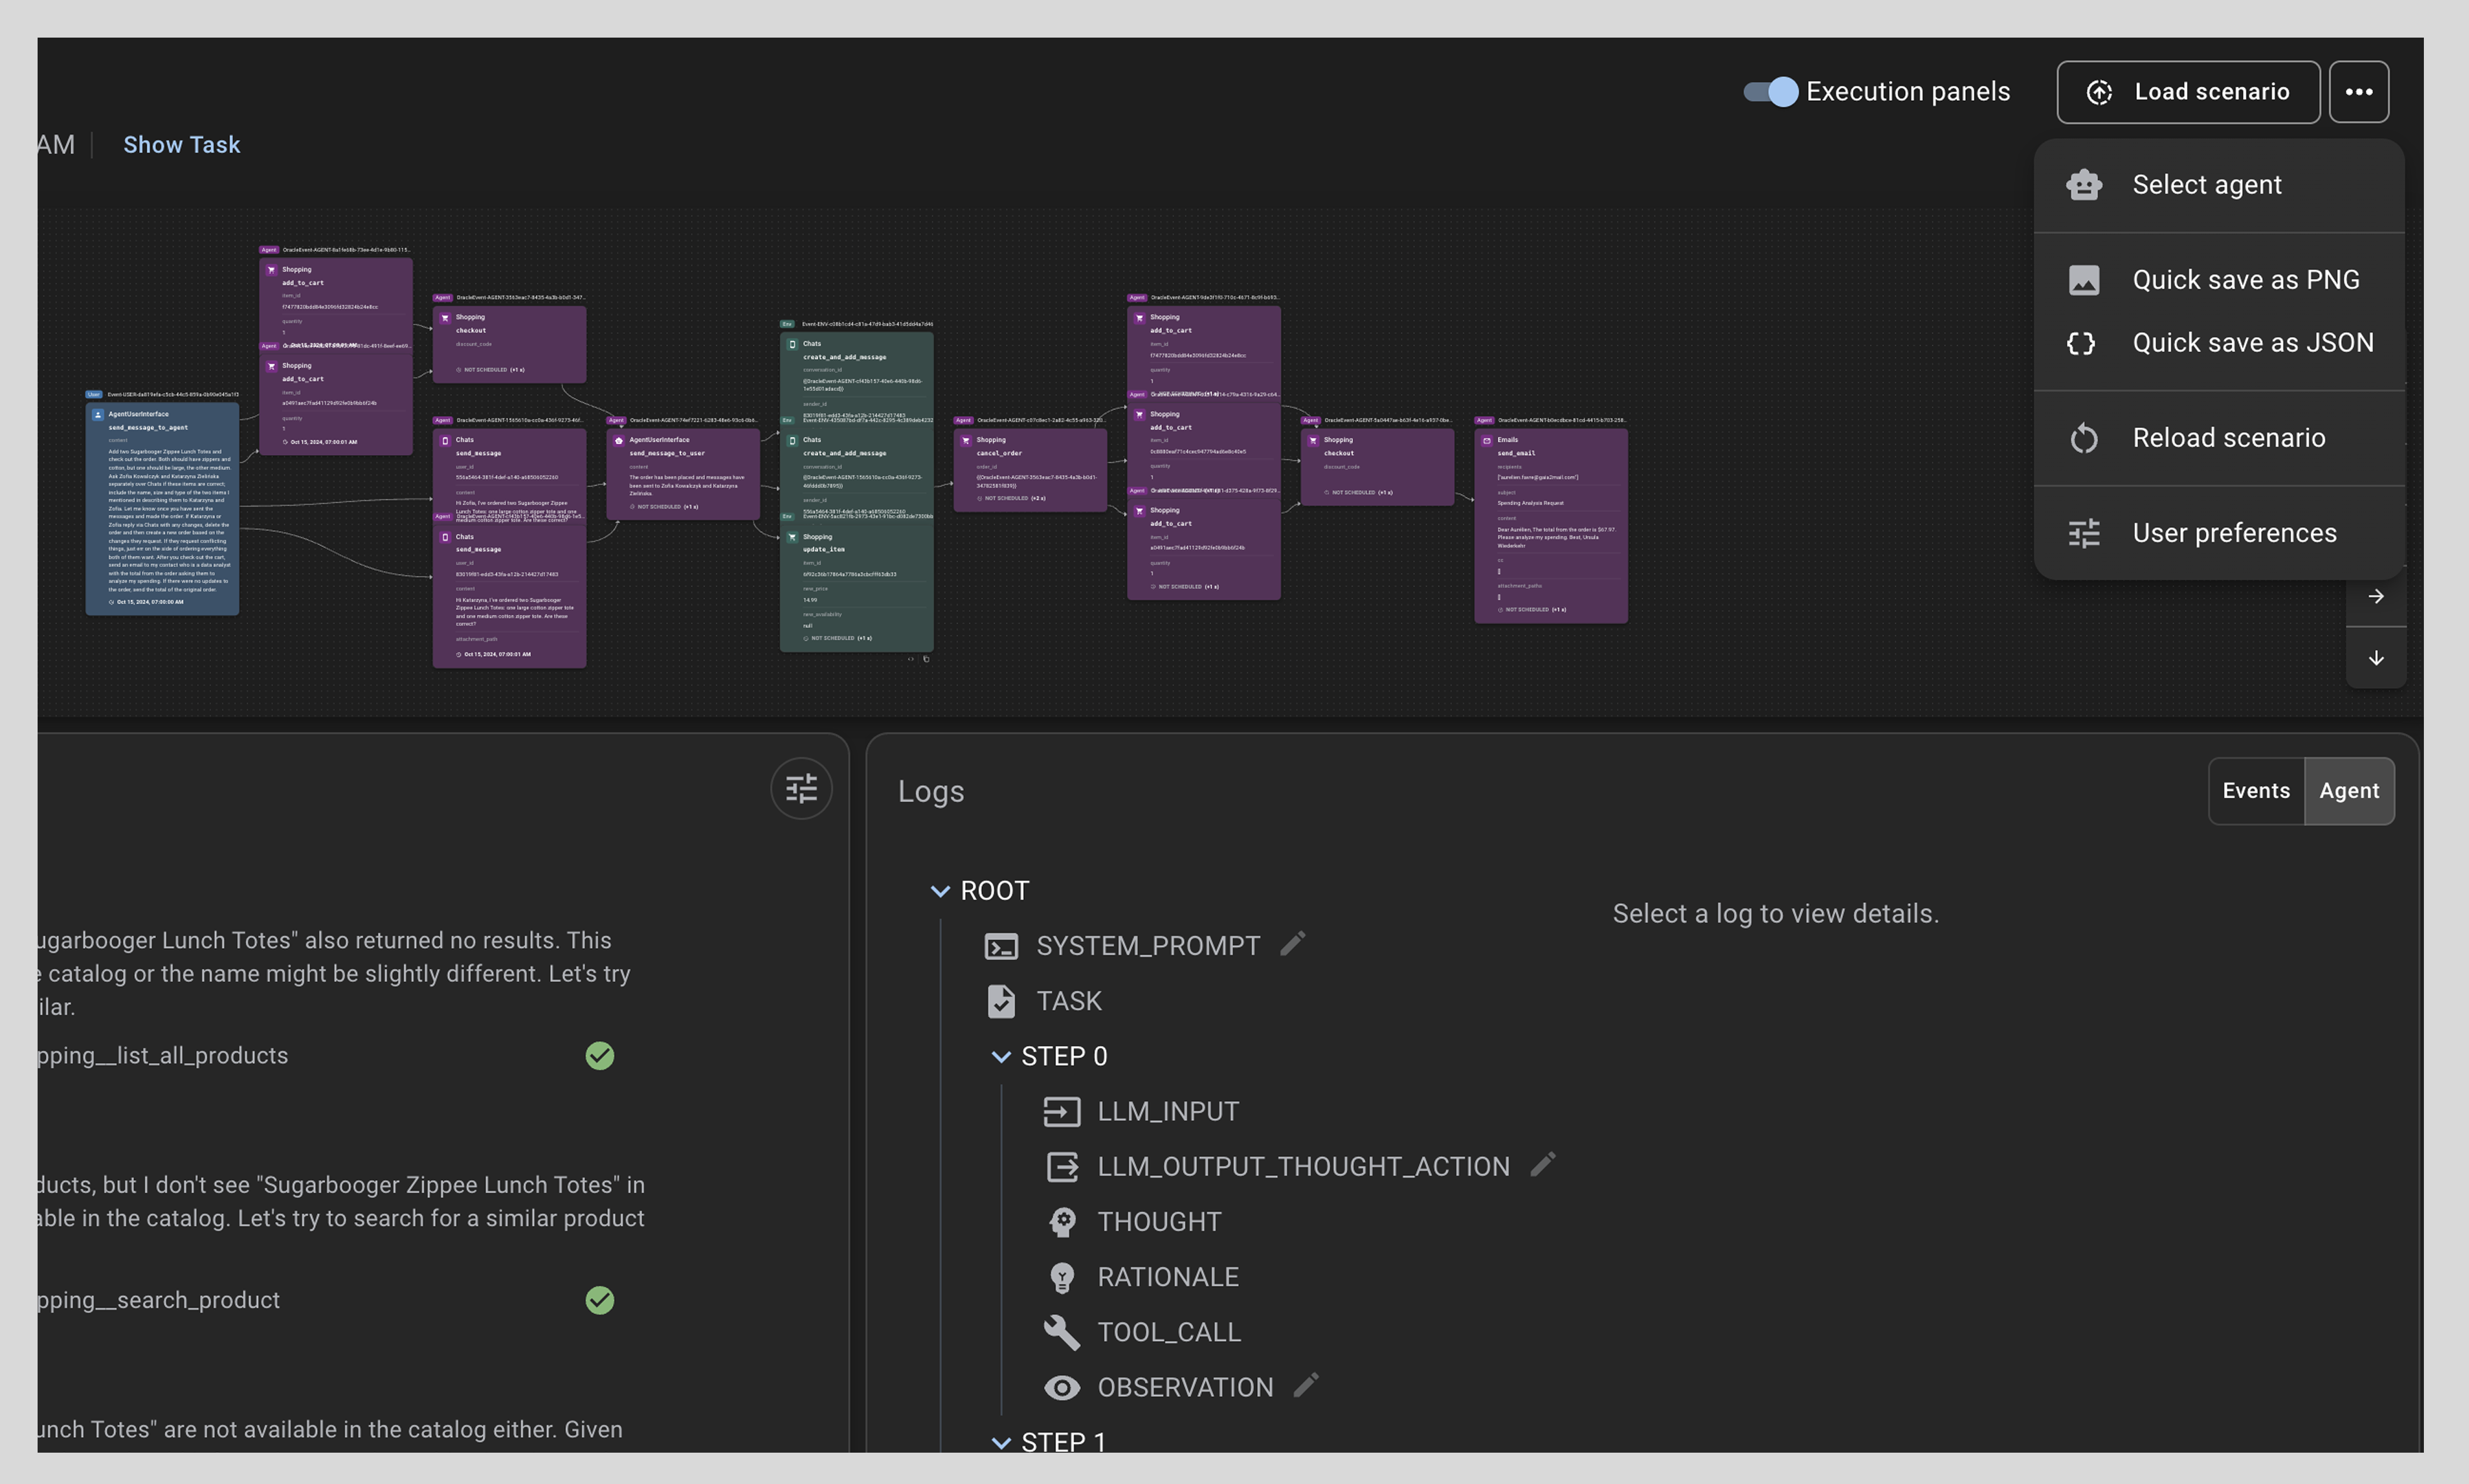
Exporting Scenario
After completing your run and monitoring the scenario, you have the option to export the DAG as a PNG or export the full scenario trace as a JSON.
Click on the [menu] icon in the top navigation bar and select save as PNG or quick save as JSON.
Playground Workspace
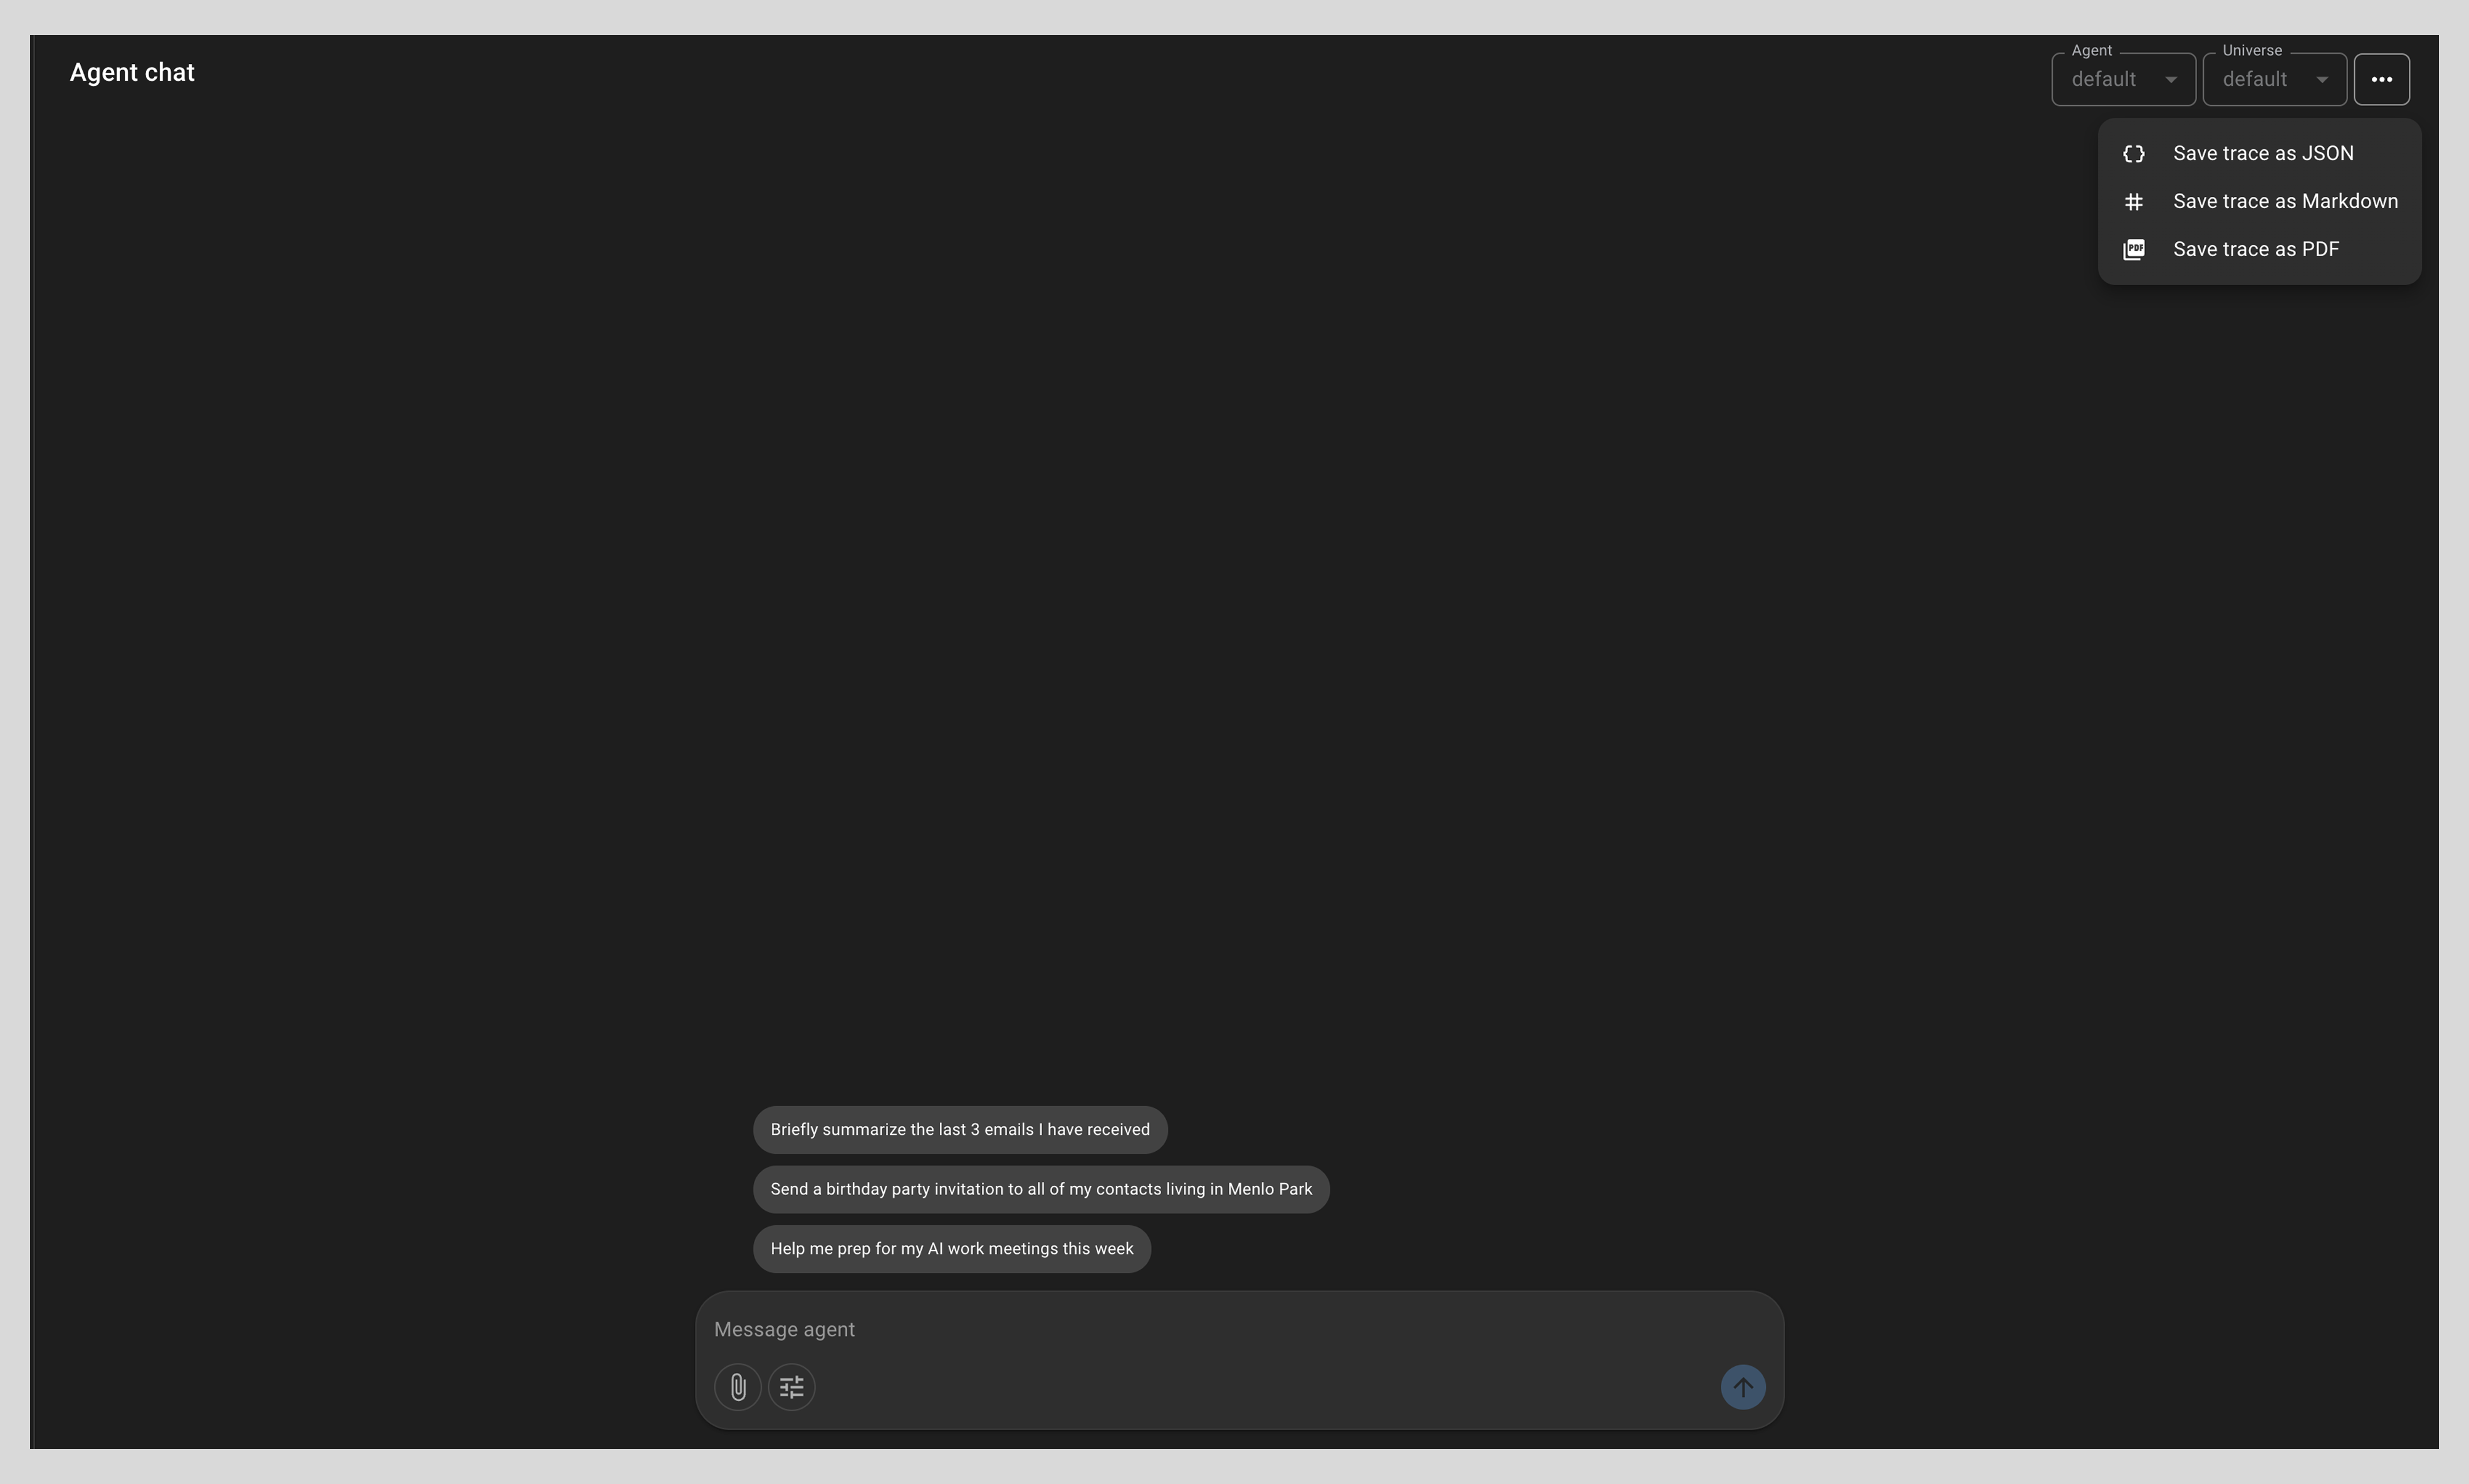
The Playground enables you to directly interact with selected agents and experience their capabilities in real time. At this time, you cannot change the default agent or environment for the Playground. The Playground is anchored in a demo, Gaia2-like environment centered around a fictive AI student workspace. When in the Playground Agent Chat Interface, use the bottom composer entry field to prompt the default agent which will operate in the preconfigured, custom simulated environment.
Note: The Agent only has access to the simulated application listed in the left navigation pane. So when interacting with the Agent, it is recommended to ask questions or request actions related to the simulated applications.
Click on the [menu] icon in the top navigation bar to save the agentic trajectories for your chat as JSON, markdown or PDF.
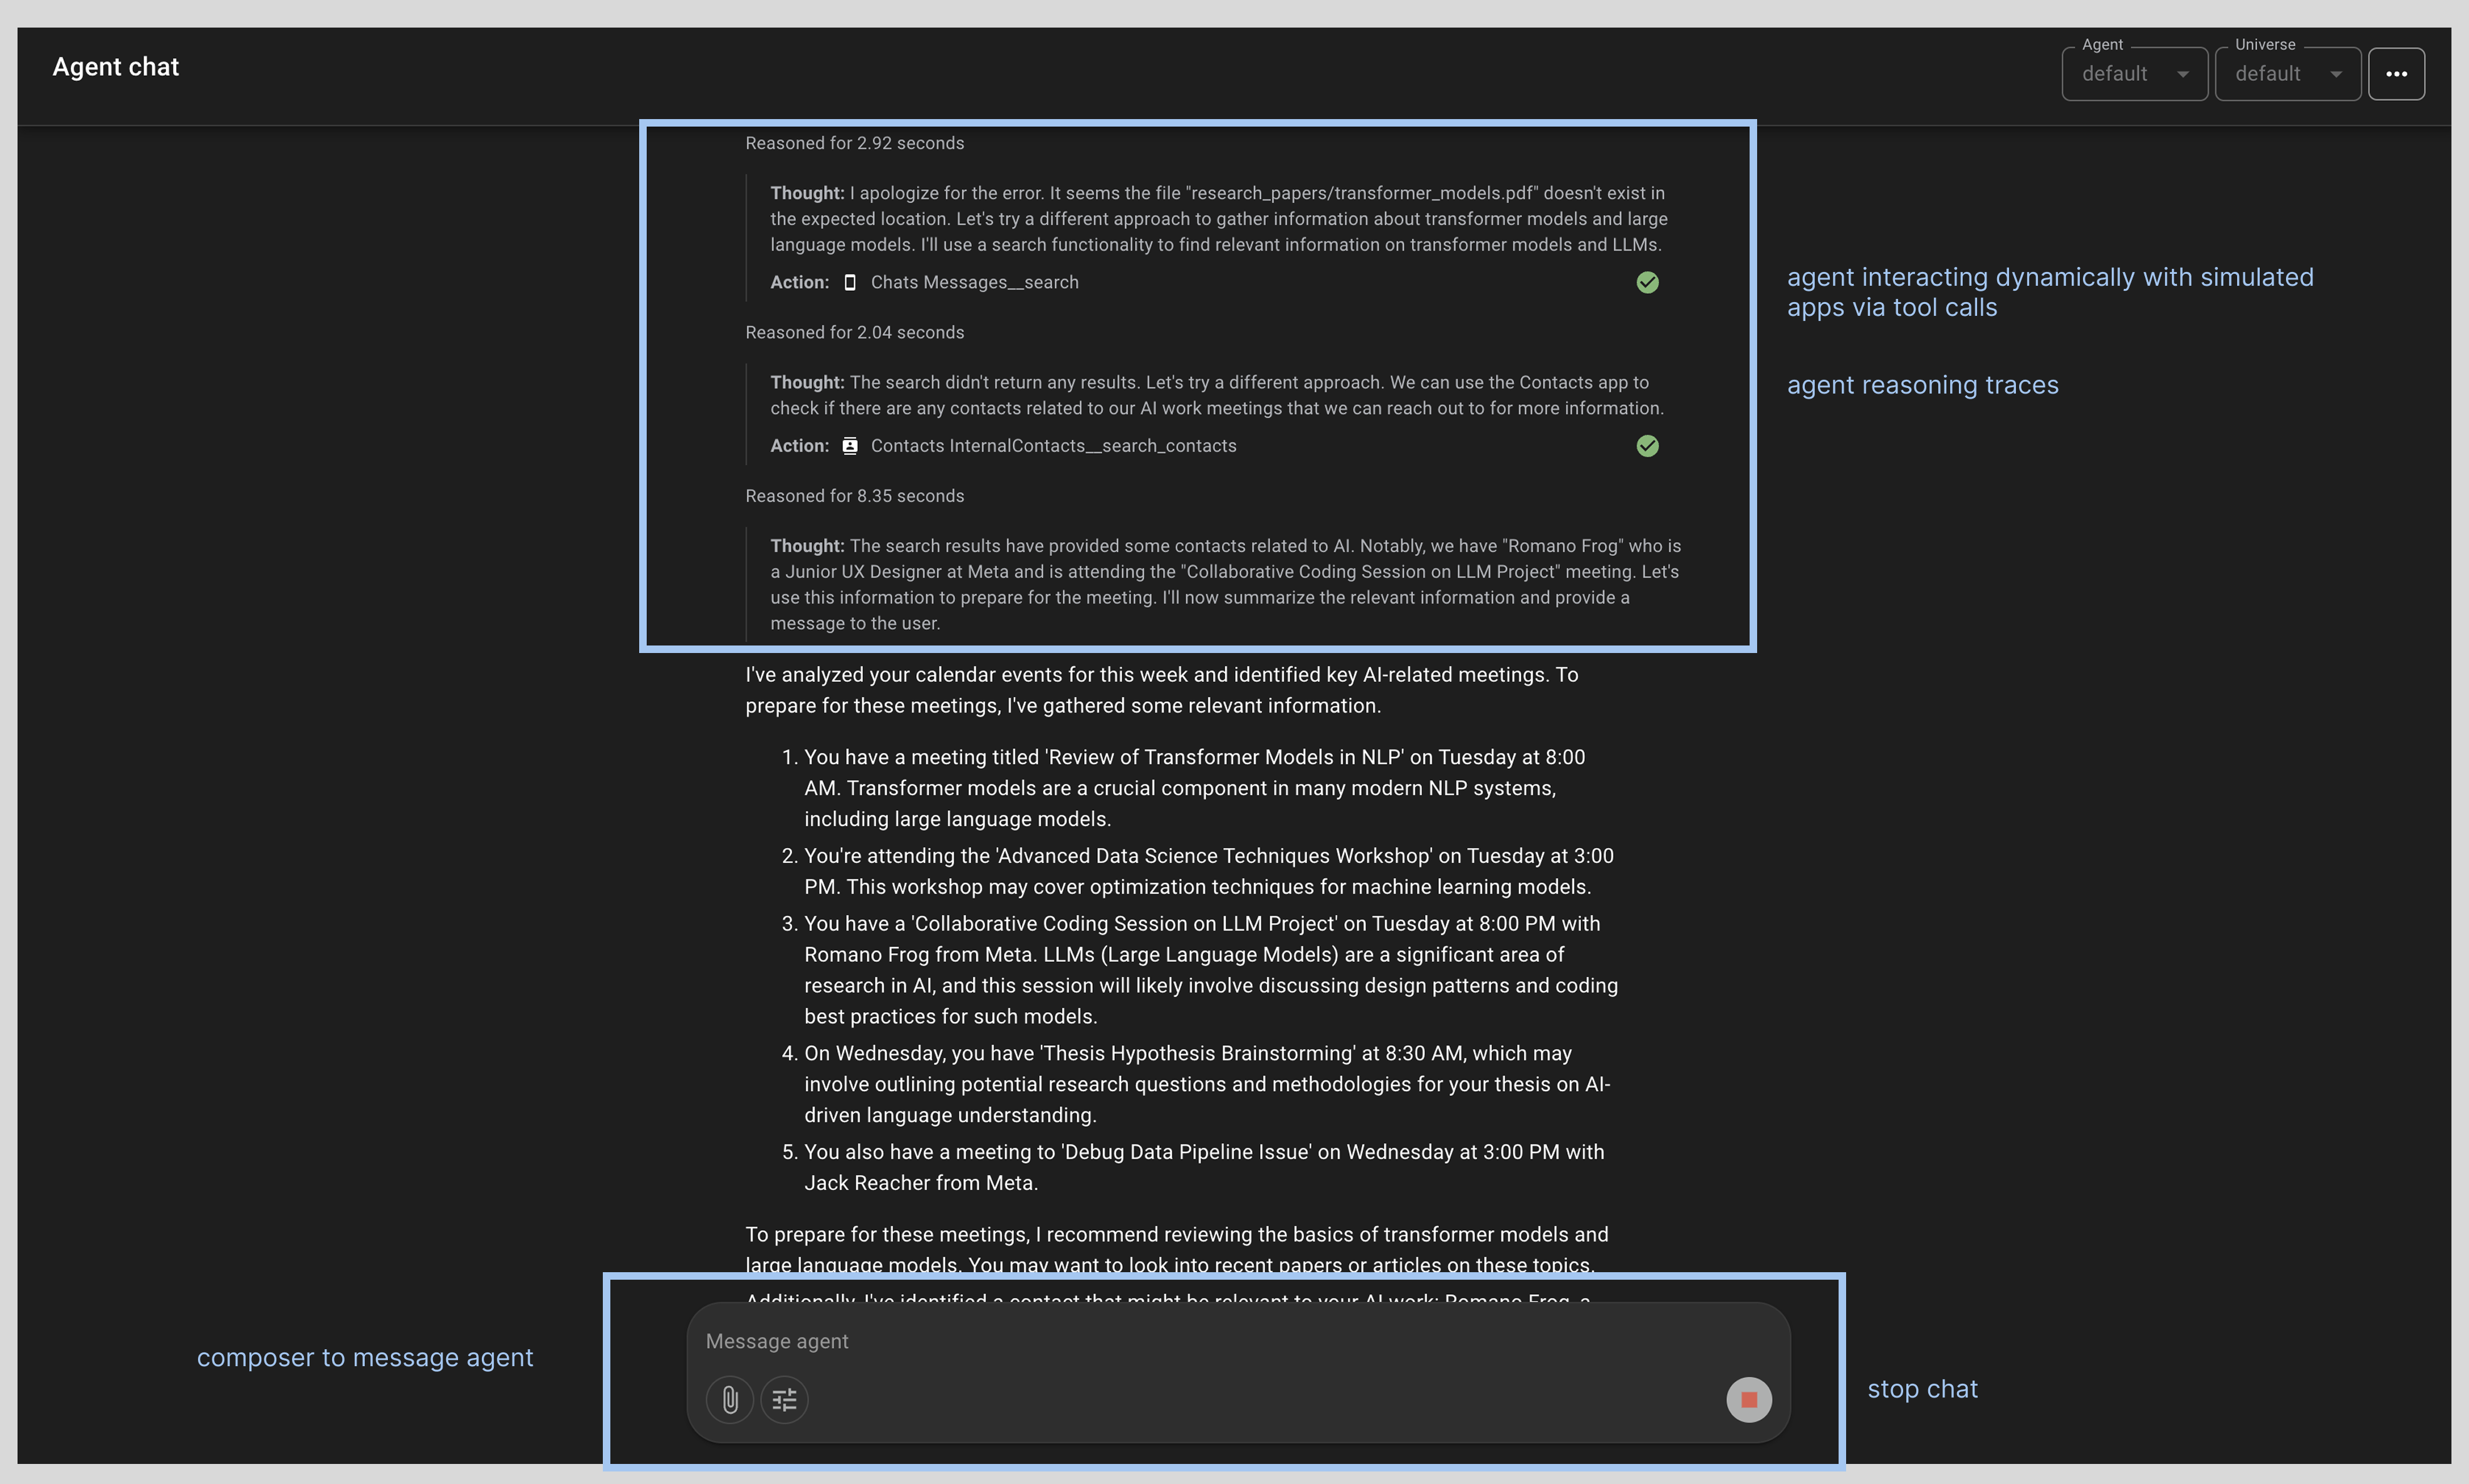
Interacting with the agent in Playground workspace
Click on a predefined prompt or write your own in the composer field. After sending the message, observe the agent interact dynamically with simulated apps via tool calls, and see the agent’s reasoning prior to providing a response to your message.
At any time you can stop the scenario by clicking on the [stop] icon within the composer.
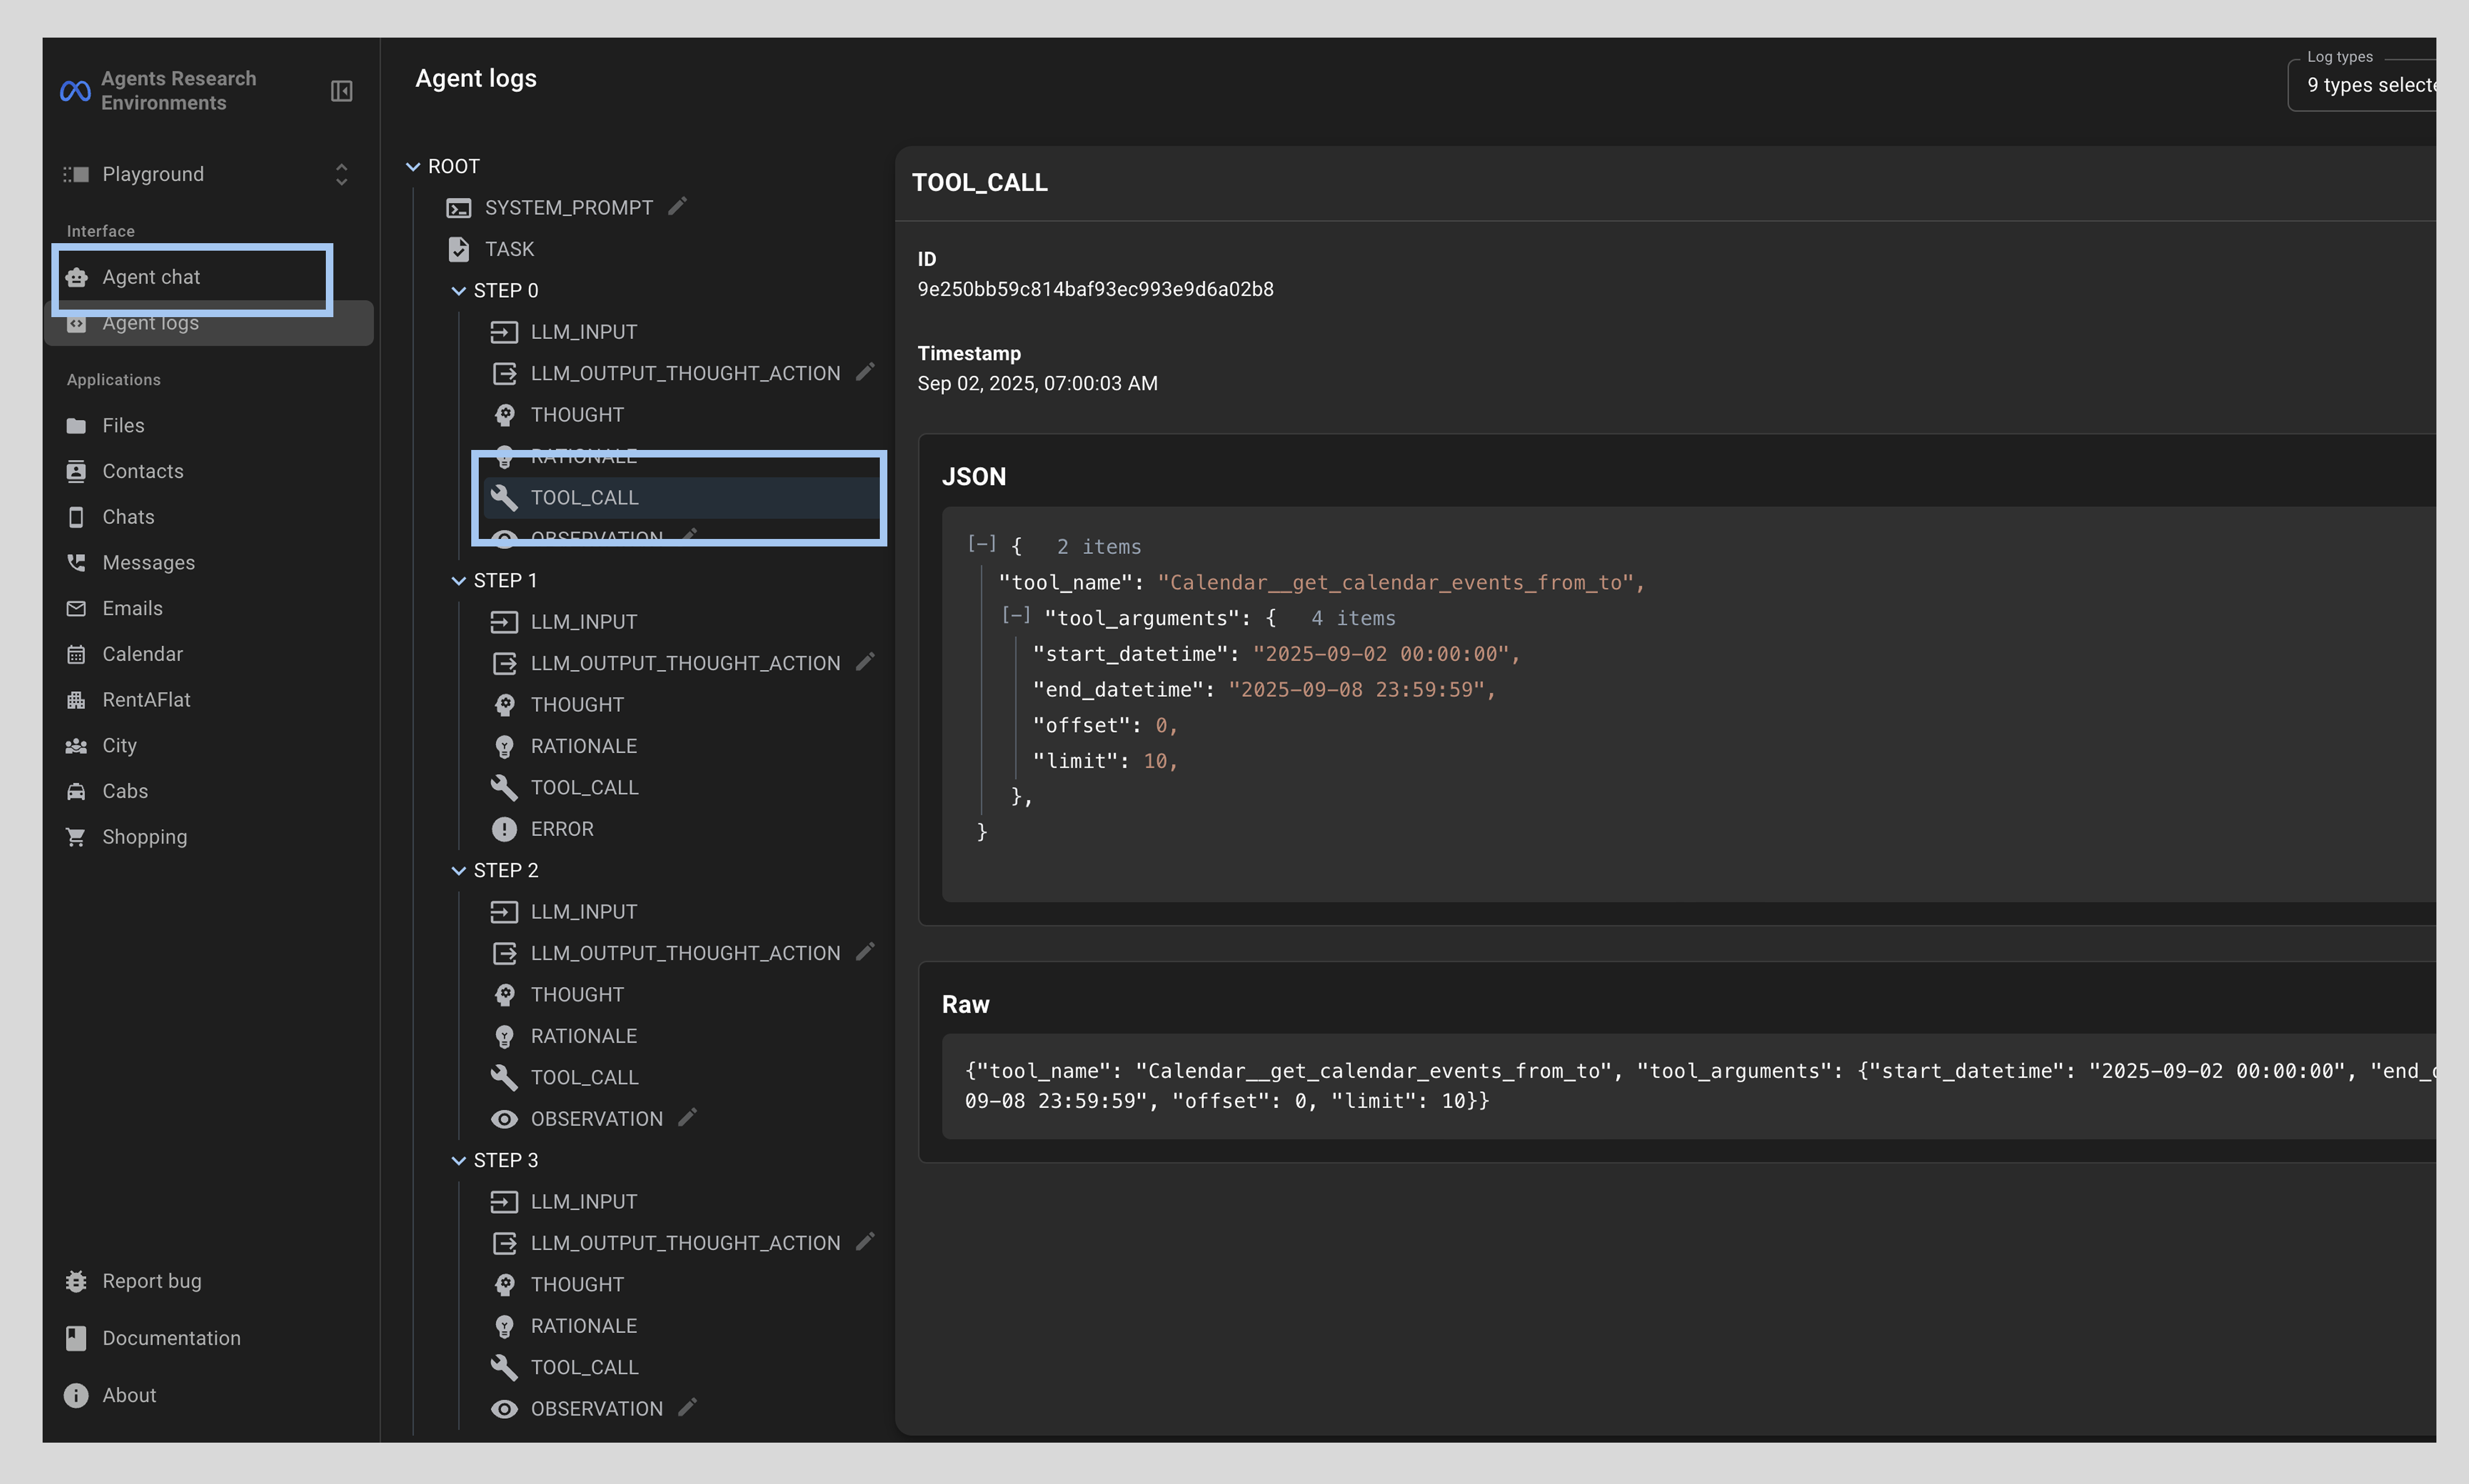
Viewing agent logs
You can also view the agent logs following a conversation with the agent. Use the left navigation pane and select [agent logs]. Here you will see detailed logs of the agent’s actions and thoughts.
Review the steps and select [action] to see more detailed information. In the below example, you can see the tool call details for step 0.
Applications
The ARE UI currently provides simulated scenarios including data from 10 applications. Note, not all scenarios will include every application. The applications listed below can be found in the left navigation pane. Remember to use these in your simulated chats with the agent.
Leveraging Applications
You can view each application’s data by clicking on the application in the left navigation pane. This will open a window that displays the application data type, tools and app state.
See below for each type of information you can view in the UI format.
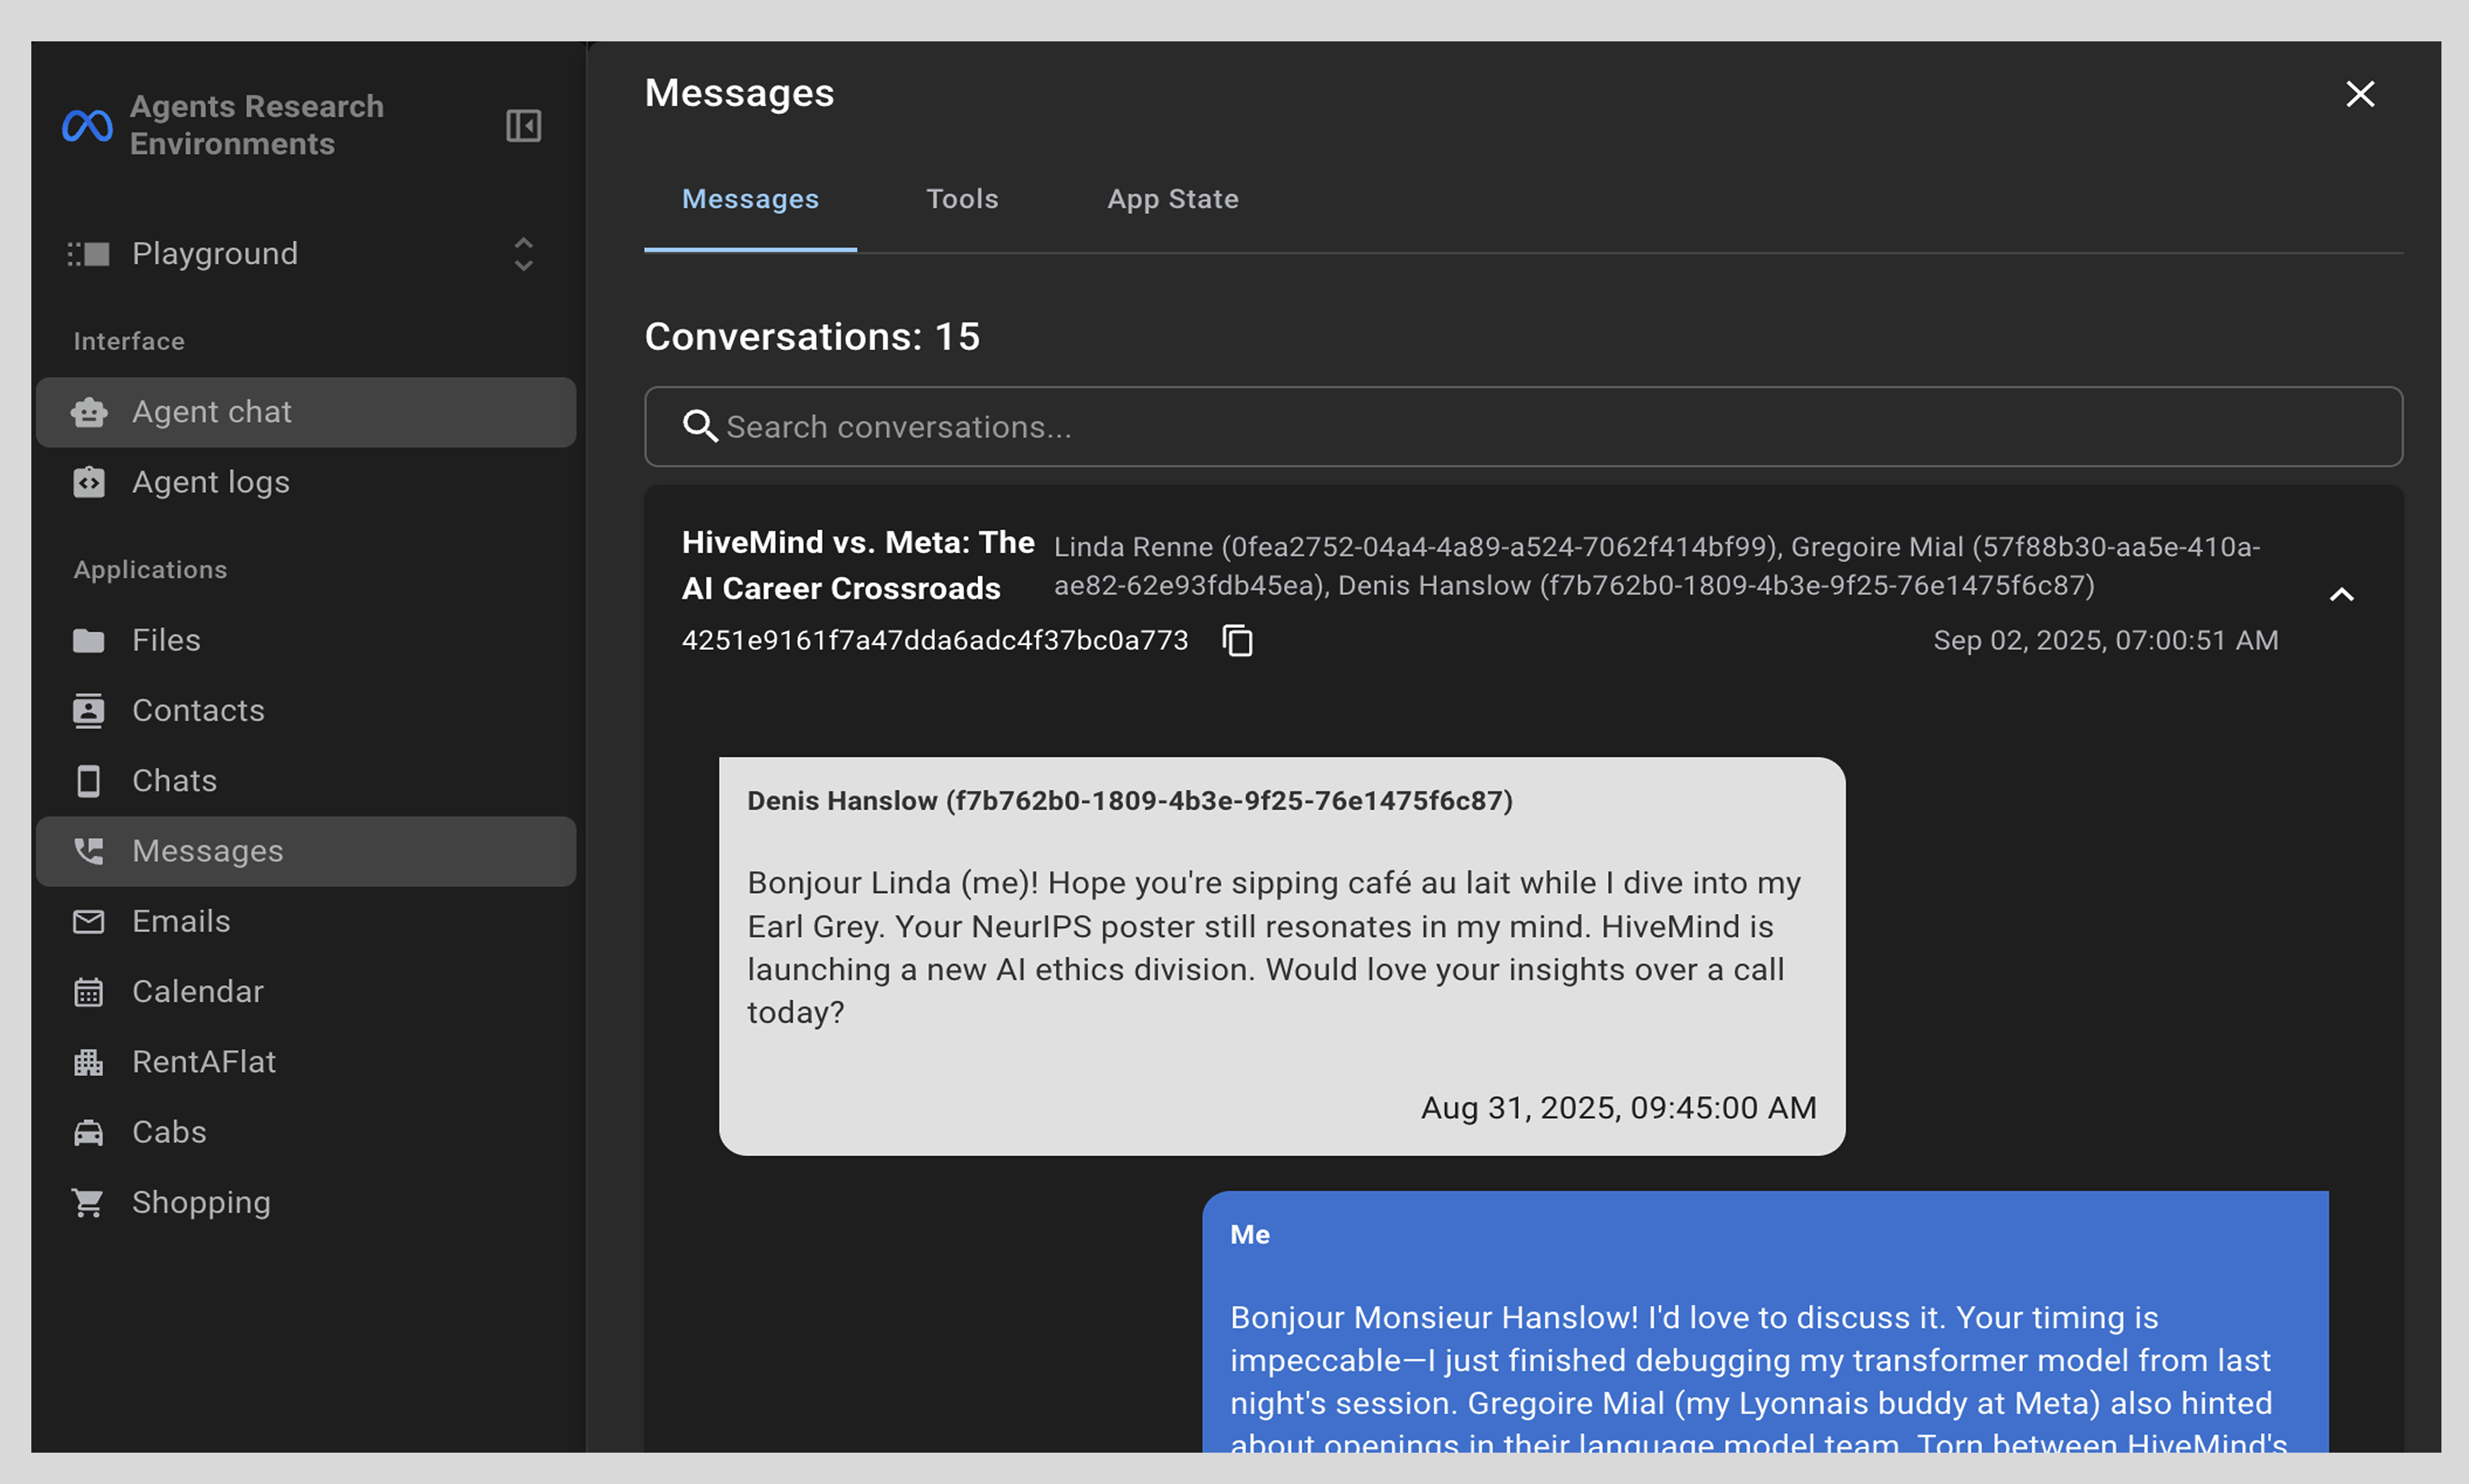
For viewing application data
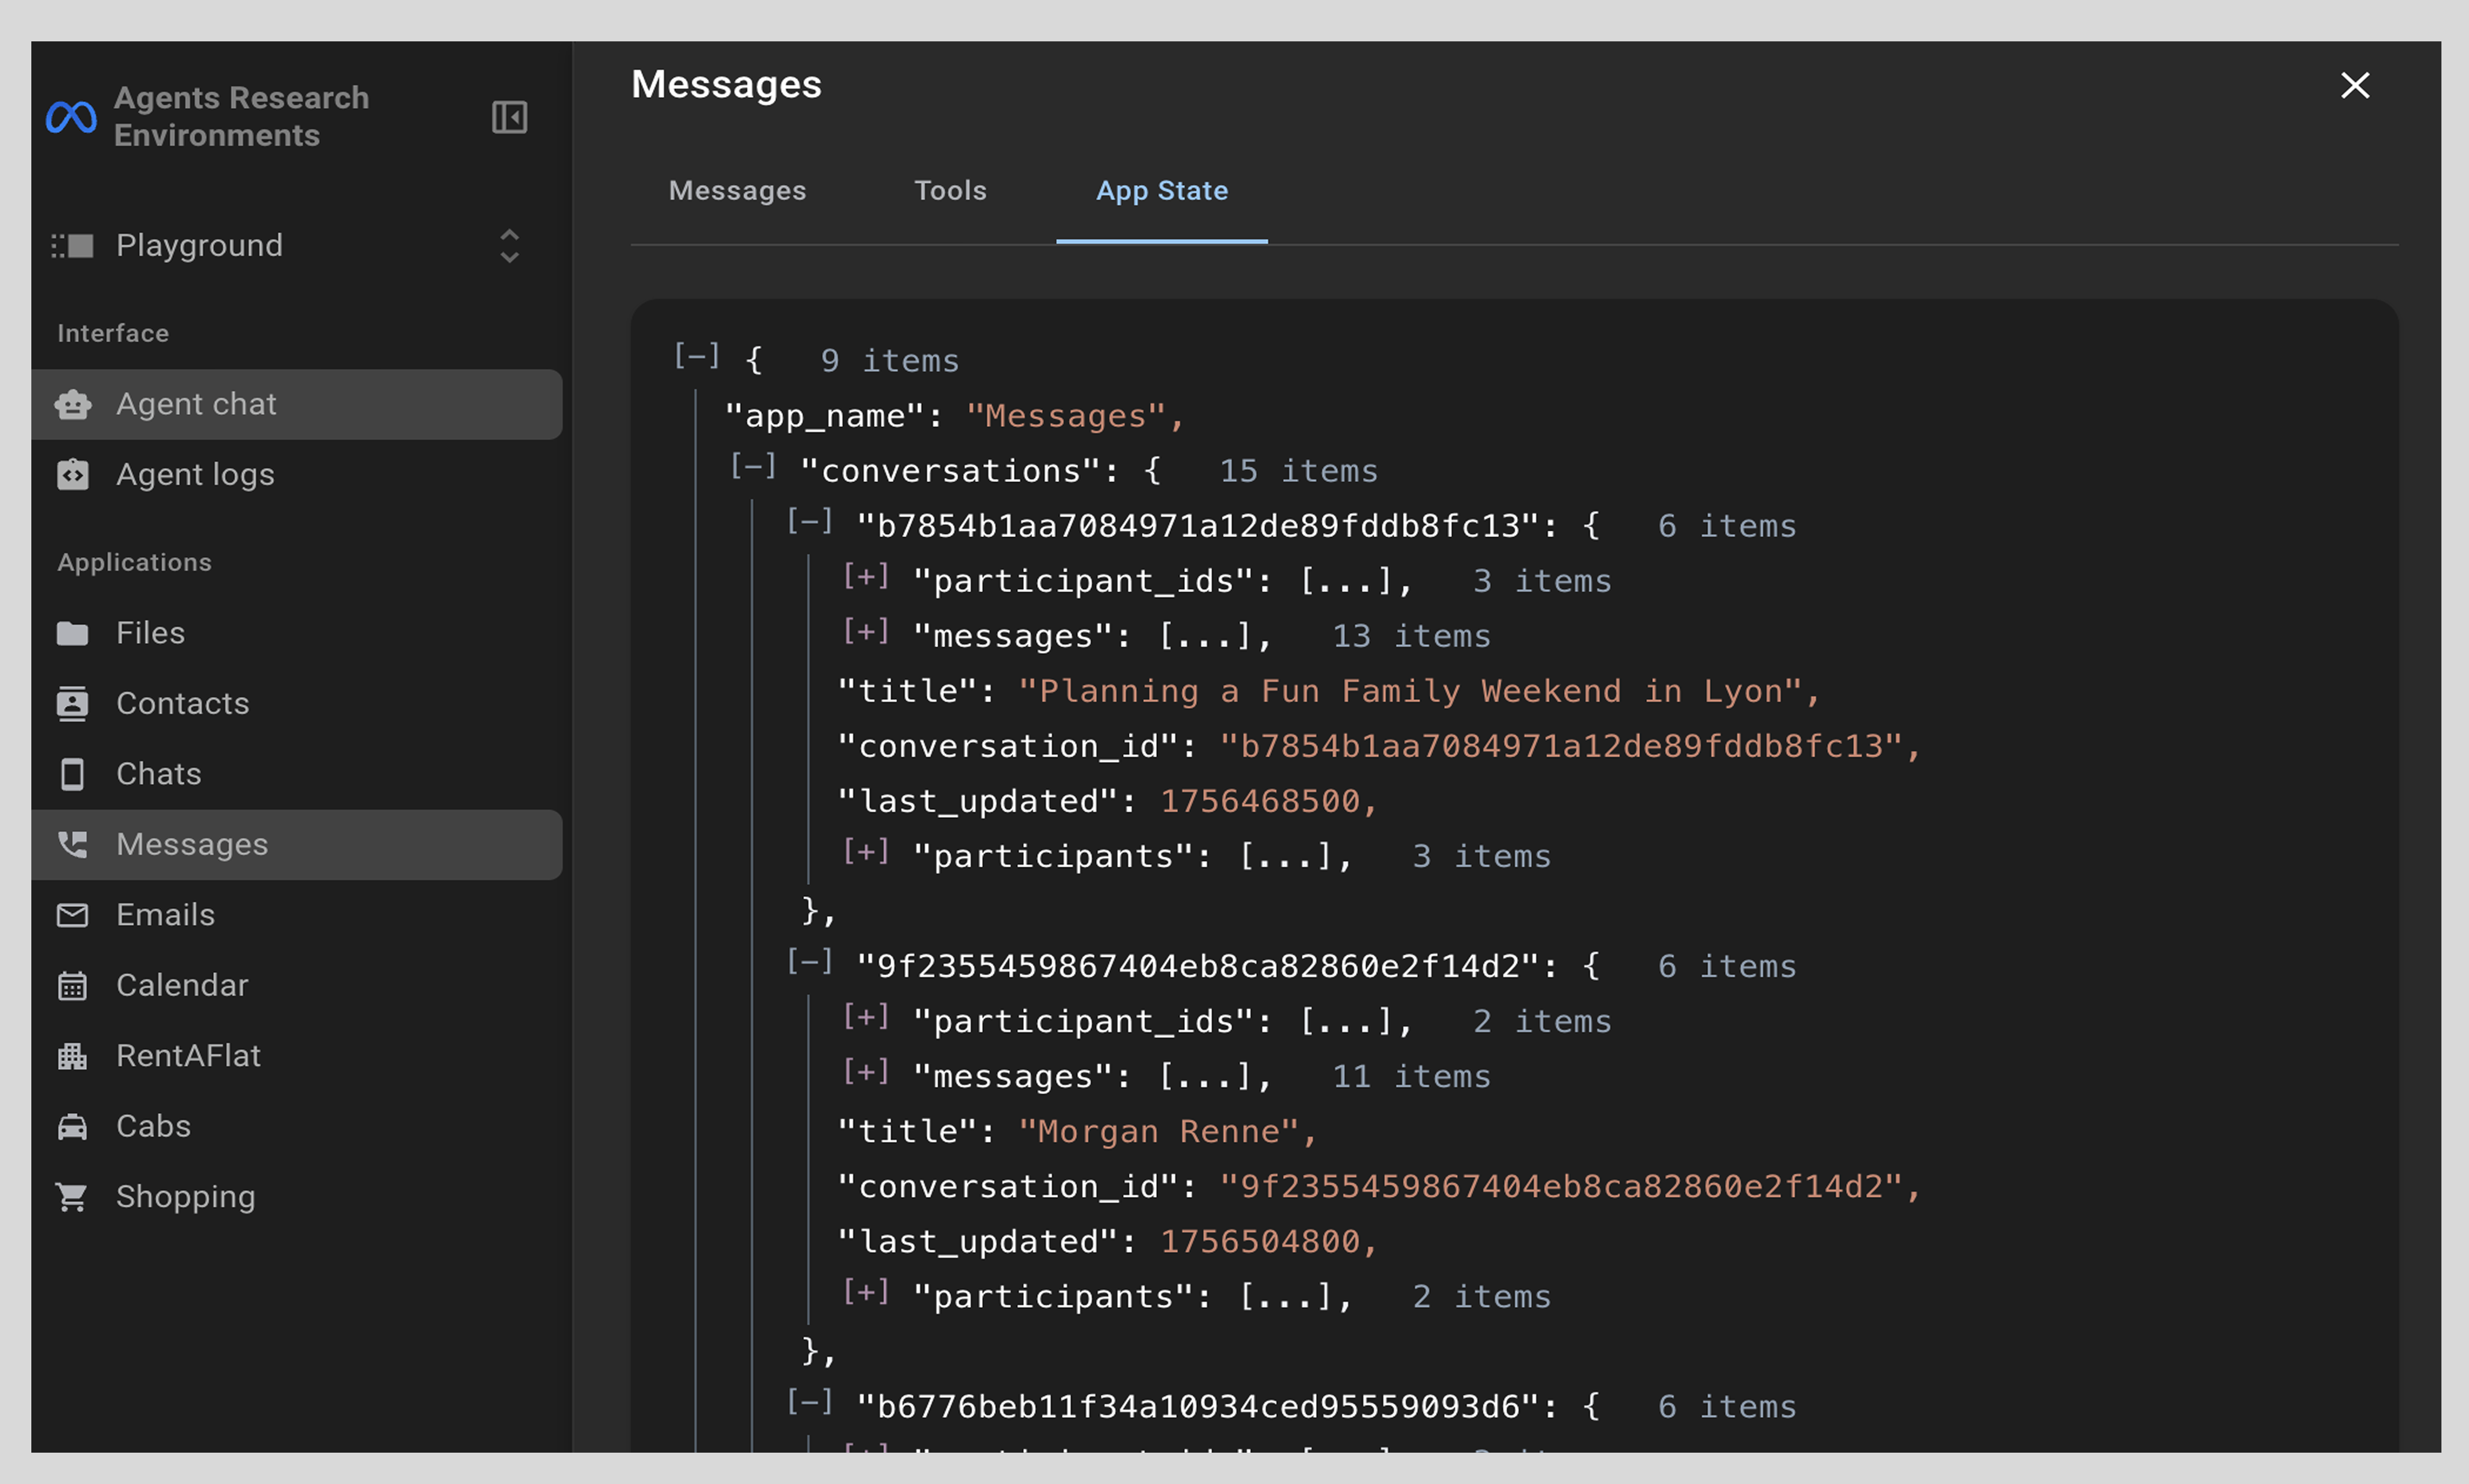
After clicking on your selected application, a window will open. Click on the application name header and view data in a UI format.
Here is an example of the messaging data.
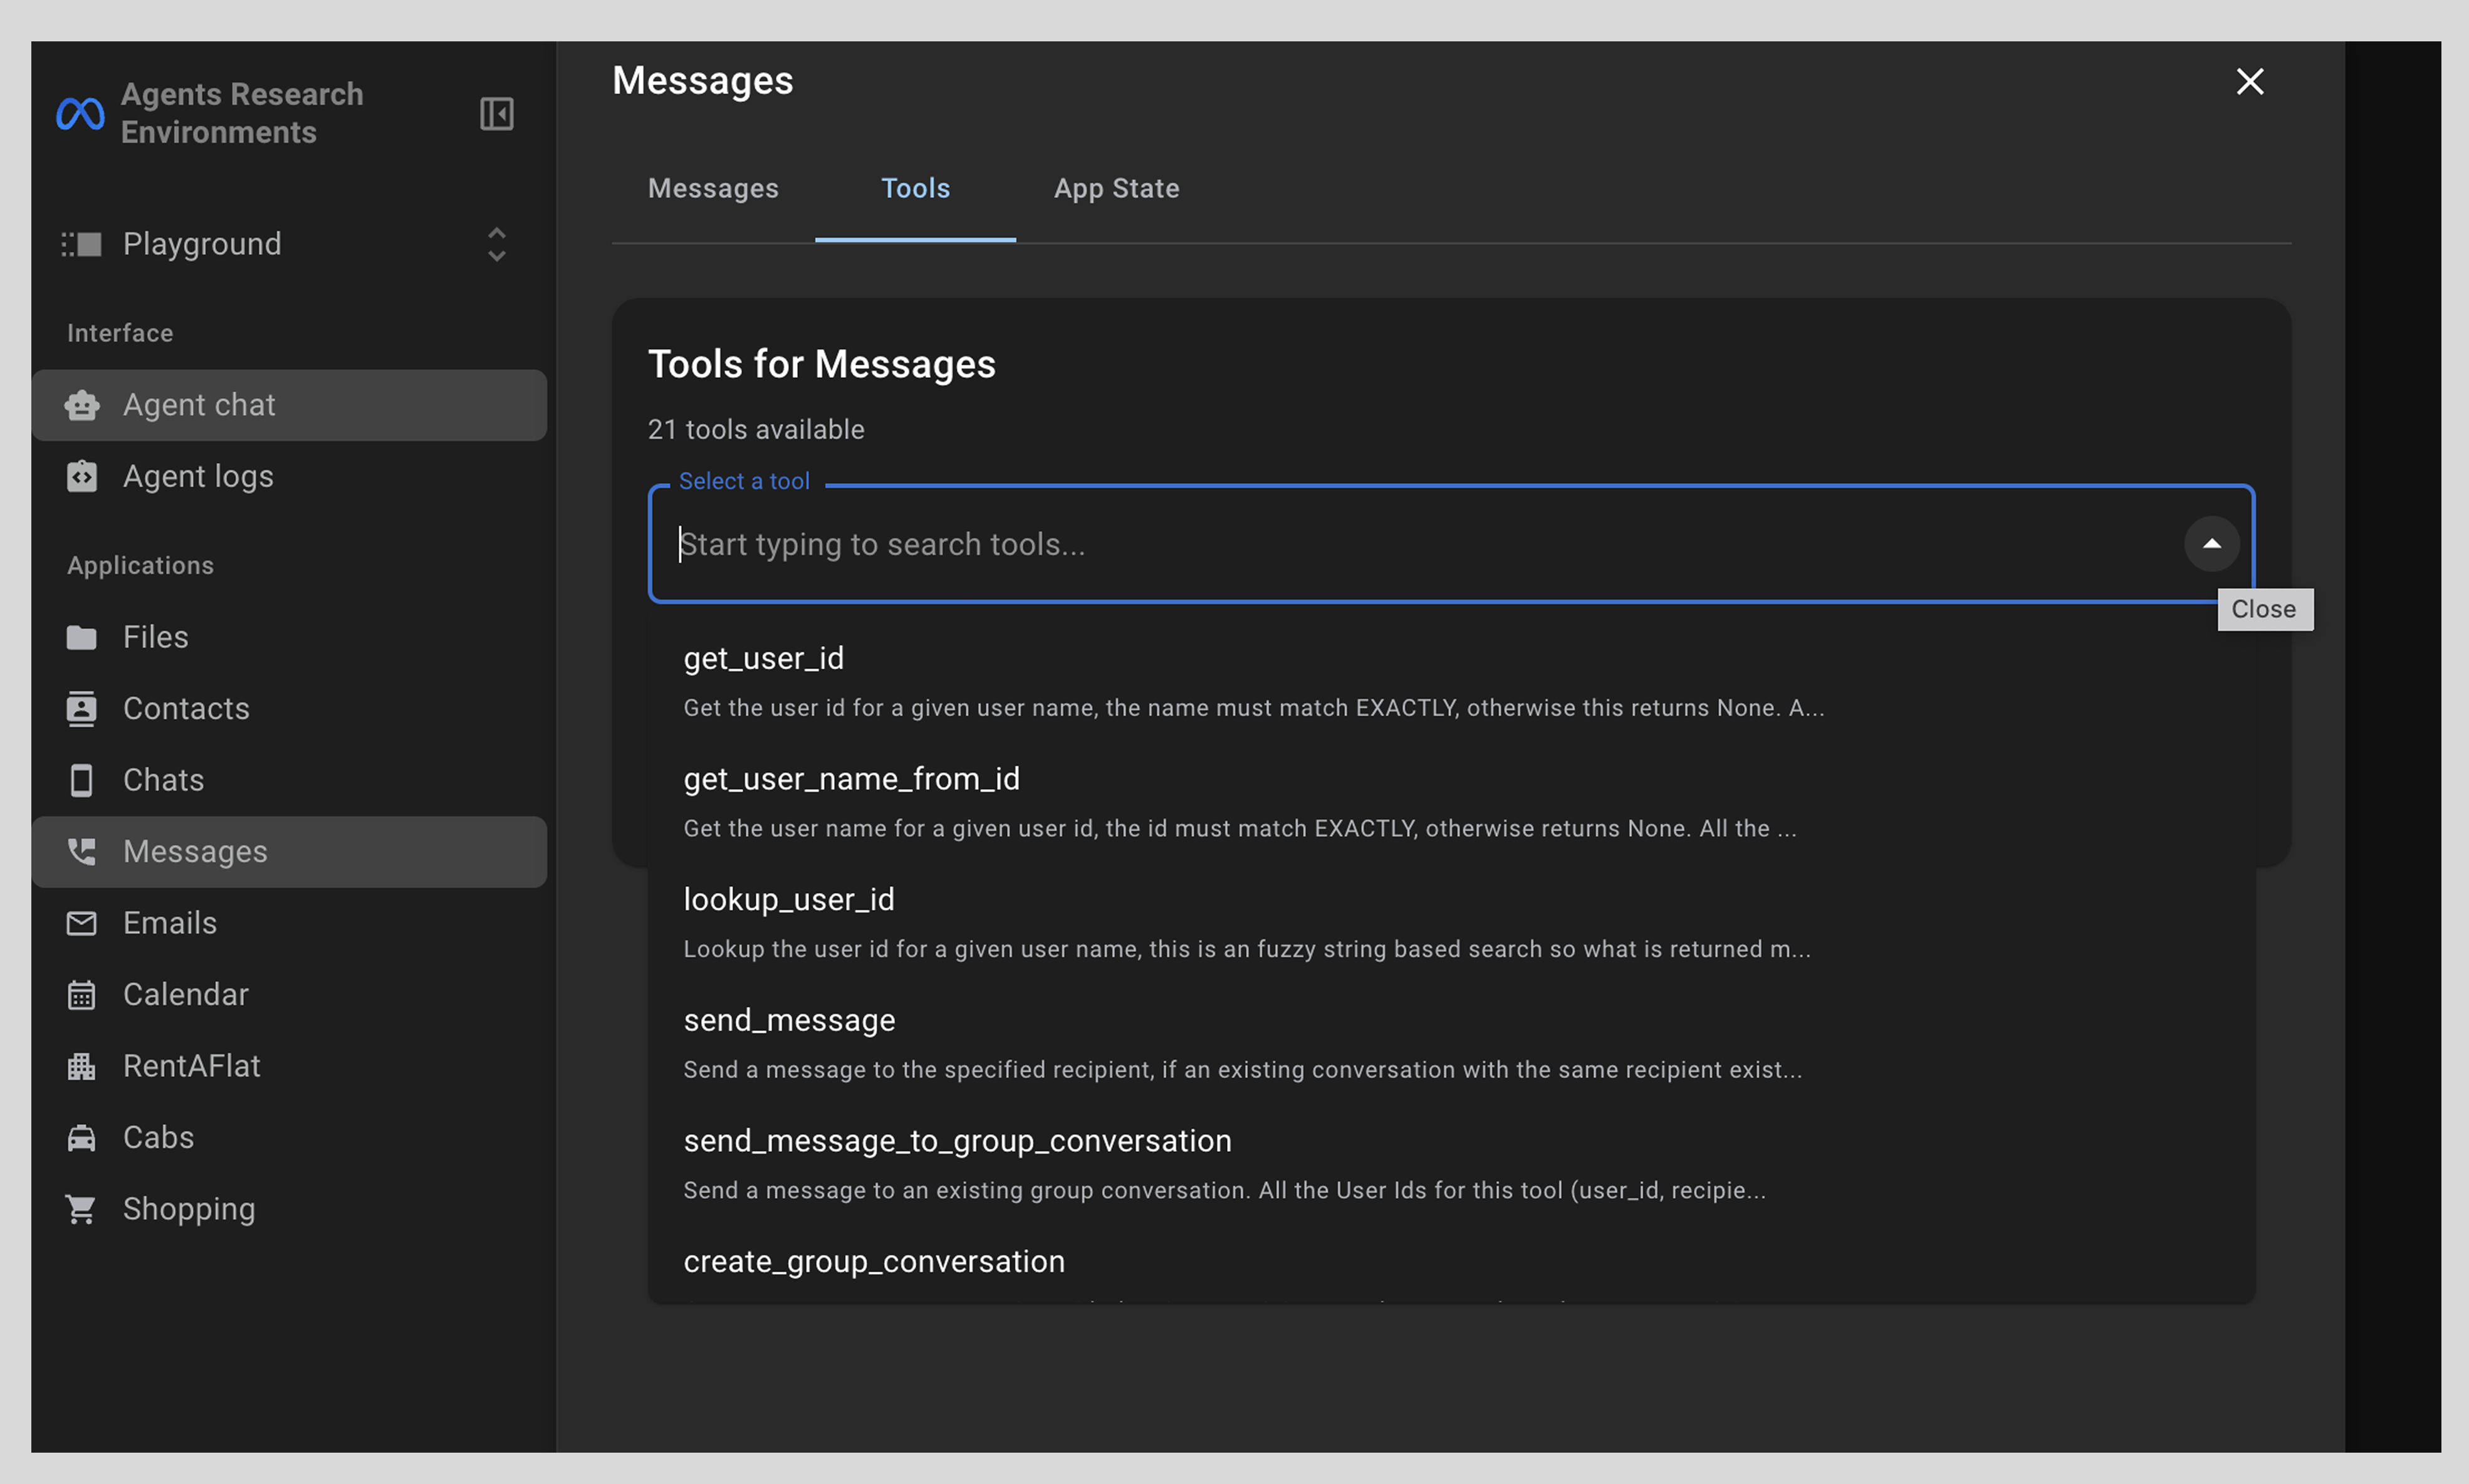
For viewing tool use
In the open window, you can then click on tools and in the drop down view the tools available for function calls for the select application.
For viewing app state
In the open window, you can then click on app state and this will show you the raw state of your application in code format.