HiPlot component for Streamlit
Streamlit is an open-source app framework. It enables data scientists and machine learning engineers to create beautiful, performant apps in pure Python.
Getting started
You’ll need both Streamlit (>=0.63 for components support) and HiPlot (>=0.18)
>>> pip install -U streamlit hiplot
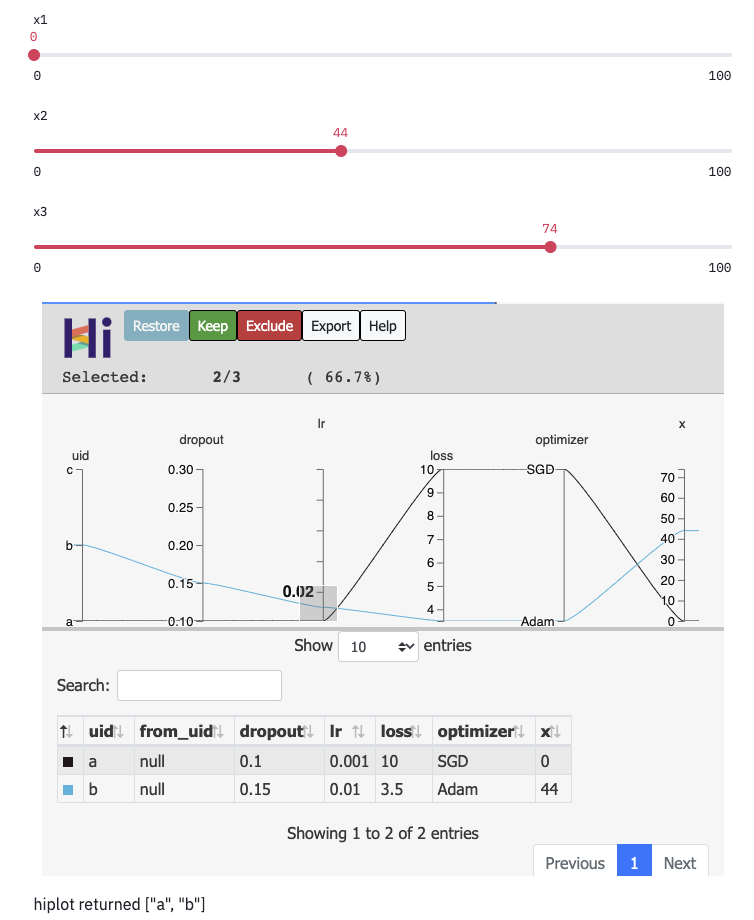
Displaying an hiplot.Experiment
Displaying an HiPlot experiment in Streamlit is very similar to how you would do it in a Jupyter notebook, except that you should call
hiplot.Experiment.to_streamlit() before calling hiplot.Experiment.display().
Note
hiplot.Experiment.to_streamlit() has a key parameter, that can
be used to assign your component a fixed identity if you want to change its
arguments over time and not have it be re-created.
If you remove the key argument in the example below, then the component will
be re-created whenever any slider changes, and lose its current configuration/state.
import json
import streamlit as st
import hiplot as hip

x1, x2, x3 = st.slider('x1'), st.slider('x2'), st.slider('x3')

# Create your experiment as usual
data = [{'uid': 'a', 'dropout': 0.1, 'lr': 0.001, 'loss': 10.0, 'optimizer': 'SGD', 'x': x1},
        {'uid': 'b', 'dropout': 0.15, 'lr': 0.01, 'loss': 3.5, 'optimizer': 'Adam', 'x': x2},
        {'uid': 'c', 'dropout': 0.3, 'lr': 0.1, 'loss': 4.5, 'optimizer': 'Adam', 'x': x3}]
xp = hip.Experiment.from_iterable(data)

# Instead of calling directly `.display()`
# just convert it to a streamlit component with `.to_streamlit()` before
ret_val = xp.to_streamlit(ret="selected_uids", key="hip").display()

st.markdown("hiplot returned " + json.dumps(ret_val))
HiPlot component return values
HiPlot is highly interactive, and there are multiple values/information that can be returned, depending on what the user provides for the parameter ret in hiplot.Experiment.to_streamlit()
ret="filtered_uids": returns a list of uid for filtered datapoints. Filtered datapoints change when the user clicks on Keep or Exclude buttons.ret="selected_uids": returns a list of uid for selected datapoints. Selected datapoints correspond to currently visible points (for example when slicing in the parallel plot) - it’s a subset of filtered datapoints.ret="brush_extents": returns information about current brush extents in the parallel plotor a list containing several values above. In that case, HiPlot will return a list with the return values
xp.to_streamlit(key="hip1").display()  # Does not return anything
filtered_uids = xp.to_streamlit(ret="filtered_uids", key="hip2").display()
filtered_uids, selected_uids = xp.to_streamlit(ret=["filtered_uids", "selected_uids"], key="hip3").display()
Improving performance with streamlit caching (EXPERIMENTAL)
Generating / displaying a large HiPlot Experiment / component can take a significant amount of time and bandwidth. Several things can speed up streamlit iterations:
A data compression mode, which represents the underlying data more efficiently if most of the rows have the same columns
Using streamlit’s caching to store a frozen copy of the experiment
import streamlit as st
import hiplot as hip
import hiplot.fetchers_demo

x1, x2, x3 = st.slider('x1'), st.slider('x2'), st.slider('x3')


@st.cache
def get_experiment():
    # We create a large experiment with 1000 rows
    big_exp = hiplot.fetchers_demo.demo(1000)
    # EXPERIMENTAL: Reduces bandwidth at first load
    big_exp._compress = True
    # ... convert it to streamlit and cache that (`@st.cache` decorator)
    return big_exp.to_streamlit(key="hiplot")


xp = get_experiment()  # This will be cached the second time
xp.display()