Getting started
Installing
Python version
HiPlot requires python version 3.6 or newer (you can check your python version with python3 --version)
Python virtualenv
We advise that you create a virtualenv for HiPlot, if you don’t use one already.
On Linux/MacOS
# Create a virtualenv
python3 -m venv venv_hiplot
# Activate it
. venv_hiplot/bin/activate
On Windows
py -3 -m venv venv_hiplot
venv_hiplot\Scripts\activate
Install HiPlot
Within the activated environment, use the following command to install HiPlot:
pip install -U hiplot # Or for conda users: conda install -c conda-forge hiplot
Congratulation, HiPlot is now ready to use! You can either:
Use it to render python data in a notebook
Or start it as a webserver to track, compare and visualize your experiments
Option 1: Use HiPlot in an ipython notebook
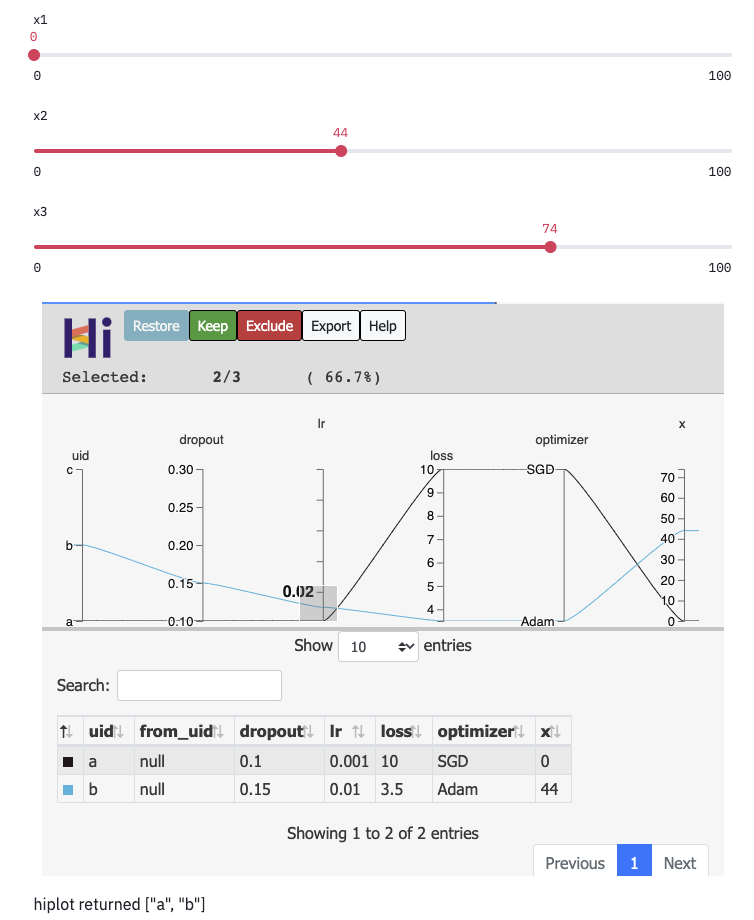
Here we assume that we have a list of several datapoints.
HiPlot can only render hiplot.Experiment objects, so we create one with hiplot.Experiment.from_iterable.
Once we have created this object, we can display it with hiplot.Experiment.display.
import hiplot as hip
data = [{'dropout':0.1, 'lr': 0.001, 'loss': 10.0, 'optimizer': 'SGD'},
        {'dropout':0.15, 'lr': 0.01, 'loss': 3.5, 'optimizer': 'Adam'},
        {'dropout':0.3, 'lr': 0.1, 'loss': 4.5, 'optimizer': 'Adam'}]
hip.Experiment.from_iterable(data).display()
Learn more in the tutorial: Advanced uses: notebooks
Option 2: Use HiPlot webserver
Within the activated environment, use the following command to run HiPlot server:
>>> hiplot
Then open your web browser in http://127.0.0.1:5005/.
In the web interface, you can enter an experiment URI - you can enter the path to a CSV file, or just type in demo, or demo_line_xy to see some basic examples.
Note
By default, hiplot only listens on localhost, which prevents anyone else from seeing your experiments. To allow anyone to connect, use
>>> hiplot --host 0.0.0.0
HiPlot webserver can do way more:
you can share the URL to a colleague - it contains all the columns you have filtered, reordered during the session
you can Compare multiple experiments
Option 3: Create data-apps using Streamlit  
Streamlit allows data scientists and machine learning engineers to create beautiful, performant apps in pure Python.
This is the best way to create custom interfaces with HiPlot. For instance, you can perform dynamic actions based on selected rows inside HiPlot (like plotting or displaying further information), and still have a sharable/deployable interface.
Learn more in the tutorial: HiPlot component for Streamlit
Here we let the user modify the dataset before displaying it
Option 4: Render standalone HTML files
We provide a CLI tool hiplot-render to render HiPlot experiments into standalone HTML files, containing all HiPlot files, and your data.
To render a demo, or your own CSV file, use:
>>> hiplot-render demo > hiplot_demo.html
>>> hiplot-render /path/to/your/file.csv > hiplot.html
If your data is not already in the CSV format, you can either convert it to CSV, or see how to Make HiPlot server render your own experiments.