Brillouin Zone Integration on a Photonic Crystal
This tutorial is derived from this script.
The traditional FMM or RCWA solvers have a significant limitation: they require both the structures and sources to be periodic. Simulating an aperiodic source necessitates the use of a supercell, which can be computationally demanding due to the unfavorable complexity scaling. FMMAX, however, offers a solution to this issue by employing Brillouin Zone (BZ) integration. This method has a distinct advantage: it allows a supercell to be transformed into several smaller primitive unit cells, which can then be simulated independently in batch. This approach significantly reduces computational demands, making it a more efficient solution for handling aperiodic sources.
In this tutorial, we will explore two scenarios using BZ integration:
(1) A dipole source inside a photonic crystal slab.
The crystal has a square unit cell with circular holes, having cross section
and dipole position as illustrated below. The dipole is located the lower-left
corner of the unit cell centered in the supercell defined by the Brillouin grid
shape. The dipole is x-oriented and centered vertically within the photonic
crystal slab.
                 ________________
                |                |
                |XX            XX|
                |XXXX        XXXX|
                |XXXX        XXXX|
                |XX            XX|
    x-dipole -> o________________|
(2) A "broadband" (with 3 wavelengths) Gaussian beam incident on a photonic crystal slab.
The crystal has a square unit cell with circular holes as illustrated below.
                 ________________
                |                |
                |XX            XX|
                |XXXX        XXXX|
                |XXXX        XXXX|
                |XX            XX|
                |________________|
First, let's define some general design parameters applicable for both scenarios.
# Permittivity of the region above and below the slab, and of the holes in the slab.
permittivity_ambient = (1.0 + 0.0j) ** 2
# Permittivity of the slab.
permittivity_slab = (1.5 + 0.0j) ** 2
# Thickness of the ambient layers above and below the slab.
thickness_ambient = 2.0
# Thickness of the photonic crystal slab.
thickness_slab = 0.8
# The unit cell pitch.
pitch = 1.0
# The diameter of the holes in the photonic crystal.
diameter = 0.7
# The size of a pixel in permittivity arrays.
resolution = 0.01
# The size of a pixel in field arrays.
resolution_fields = 0.01
# The wavelength of the dipole emission.
wavelength = 0.63
# The number of terms in the Fourier expansion.
approximate_num_terms = 50
# The shape of the grid used for Brillouin zone integration.
brillouin_grid_shape = (9, 9)
Scenario 1: Aperiodic dipole source inside a photonic crystal slab.
Setting up the simulation
First, we calculate the basis expansion with circular truncation.
from jax import numpy as jnp
from fmmax import basis

primitive_lattice_vectors = basis.LatticeVectors(
    u=pitch * basis.X, v=pitch * basis.Y
)
expansion = basis.generate_expansion(
    primitive_lattice_vectors=primitive_lattice_vectors,
    approximate_num_terms=approximate_num_terms,
    truncation=basis.Truncation.CIRCULAR,
)
In our simulation of aperiodic dipole sources, it's crucial to define the Bloch phase. This phase establishes a relationship between the two sides of the primitive unit cell. For this purpose, we can conveniently utilize the basis.brillouin_zone_in_plane_wavevector() function. This function generates the Bloch phase (referred to as in_plane_wavevector) based on the shape of the Brillouin zone grid (M x N) and the lattice vectors of the primitive unit cell. This function returns M x N wavevectors.
import functools
from fmmax import fmm, basis

# Brillouin zone integration creates a batch of in-plane wavevectors which are
# distributed throughout the first Brillouin zone.
in_plane_wavevector = basis.brillouin_zone_in_plane_wavevector(
    brillouin_grid_shape, primitive_lattice_vectors
)
# check the shape of in_plane_wavevector, should be (M, N, 2)
print(in_plane_wavevector.shape)
(9, 9, 2)
Since we will be using the same parameters to solve for eigenmodes inside our Brillouin Zone, we can once again compose a partial function for the ease of reuse.
eigensolve = functools.partial(
    fmm.eigensolve_isotropic_media,
    wavelength=jnp.asarray(wavelength),
    in_plane_wavevector=in_plane_wavevector,
    primitive_lattice_vectors=primitive_lattice_vectors,
    expansion=expansion,
    formulation=fmm.Formulation.FFT,
)
Here, we construct a function called unit_cell_pattern() that generates the permittivity distribution in the xy directions. Let's also visualize it.
import jax.numpy as jnp
import matplotlib.pyplot as plt  # type: ignore[import]

def unit_cell_pattern(
    pitch: float,
    diameter: float,
    resolution: float,
) -> jnp.ndarray:
    """Defines the pattern of the photonic crystal."""
    x, y = jnp.meshgrid(
        jnp.arange(0, pitch, resolution),
        jnp.arange(0, pitch, resolution),
        indexing="ij",
    )
    return (jnp.sqrt((x - pitch / 2) ** 2 + y**2) < diameter / 2) | (
        jnp.sqrt((x - pitch / 2) ** 2 + (y - pitch) ** 2) < diameter / 2
    )

# Try plotting a unit cell.
mask = unit_cell_pattern(pitch, diameter, resolution)

plt.imshow(mask)
plt.show()
Now, we can solve for the eigemodes in the crystal as well as the ambient regions.
permittivity_crystal = jnp.where(mask, permittivity_ambient, permittivity_slab)
solve_result_crystal = eigensolve(permittivity=permittivity_crystal)
solve_result_ambient = eigensolve(
    permittivity=jnp.asarray(permittivity_ambient)[jnp.newaxis, jnp.newaxis]
)
To model a dipole inside the photonic crystal we must break the stack into two, and compute scattering matrices for the stacks above and below the plane containing the dipole. Since we want to visualize fields, we also need the interior scattering matrices.
from fmmax import scattering

# Convert the thicknesses values to jax arrays.
thickness_ambient = jnp.asarray(thickness_ambient)
thickness_slab = jnp.asarray(thickness_slab)

s_matrices_interior_before_source = scattering.stack_s_matrices_interior(
    layer_solve_results=[solve_result_ambient, solve_result_crystal],
    layer_thicknesses=[thickness_ambient, thickness_slab / 2],
)
s_matrices_interior_after_source = scattering.stack_s_matrices_interior(
    layer_solve_results=[solve_result_crystal, solve_result_ambient],
    layer_thicknesses=[thickness_slab / 2, thickness_ambient],
)

# Extract the scattering matrices relating fields at the two ends of each substack.
s_matrix_before_source = s_matrices_interior_before_source[-1][0]
s_matrix_after_source = s_matrices_interior_after_source[-1][0]
Now let's generate the dipole source using the source.dirac_delta_source() and place it in the middle of the 9 x 9 grid.
Note that since we are using BZ zone grid, each primitive cell needs its own source expansion. So the result Fourier coefficients of the point dipole is a batched tensor in the shape of M x N x B x 1, where B is the total number of Fourier orders.
from fmmax import sources

# Generate the Fourier representation of a point dipole.
dipole_x = pitch * brillouin_grid_shape[0] // 2
dipole_y = pitch * brillouin_grid_shape[1] // 2
dipole = sources.dirac_delta_source(
    location=jnp.asarray([[dipole_x, dipole_y]]),
    in_plane_wavevector=in_plane_wavevector,
    primitive_lattice_vectors=primitive_lattice_vectors,
    expansion=expansion,
)
print(dipole.shape)
(9, 9, 45, 1)
With the Fourier coefficients calculated for our dipole source, we can inject it into our structure given the adjacent S-matrices, and calculate the forward and backward amplitudes.
# Compute backward eigenmode amplitudes at the end of the layer before the
# source, and the forward amplitudes the start of the layer after the source.
(
    _,
    _,
    bwd_amplitude_before_end,
    fwd_amplitude_after_start,
    _,
    _,
) = sources.amplitudes_for_source(
    jx=dipole,
    jy=jnp.zeros_like(dipole),
    jz=jnp.zeros_like(dipole),
    s_matrix_before_source=s_matrix_before_source,
    s_matrix_after_source=s_matrix_after_source,
)
Then, we can plug the amplitudes into the interior S-matrices to calculate the interior amplitudes. Note that, again, the Fourier coefficients for each layer and direction is batched.
from fmmax import fields

# Compute the fields inside the structure.
amplitudes_interior = fields.stack_amplitudes_interior_with_source(
    s_matrices_interior_before_source=s_matrices_interior_before_source,
    s_matrices_interior_after_source=s_matrices_interior_after_source,
    backward_amplitude_before_end=bwd_amplitude_before_end,
    forward_amplitude_after_start=fwd_amplitude_after_start,
)
print(amplitudes_interior[0][0].shape)
(9, 9, 90, 1)
Brillouin Zone Integration and Visualization
Now that we have computed the Fourier amplitudes of the interior fields, we shall convert them into Cartesian coordinates for visualization.
# Coordinates where fields are to be evaluated.
x = jnp.arange(0, pitch * brillouin_grid_shape[0], resolution_fields)
y = jnp.ones_like(x) * pitch * brillouin_grid_shape[1] // 2
(ex, ey, ez), (hx, hy, hz), (x, y, z) = fields.stack_fields_3d_on_coordinates(
    amplitudes_interior=amplitudes_interior,
    layer_solve_results=[
        solve_result_ambient,
        solve_result_crystal,
        solve_result_crystal,
        solve_result_ambient,
    ],
    layer_thicknesses=[
        thickness_ambient,
        thickness_slab / 2,
        thickness_slab / 2,
        thickness_ambient,
    ],
    layer_znum=[
        int(thickness_ambient / resolution_fields),
        int(thickness_slab / resolution_fields / 2),
        int(thickness_slab / resolution_fields / 2),
        int(thickness_ambient / resolution_fields),
    ],
    x=x,
    y=y,
)
Now, we can perform the Brillouin zone integration by averaging over the Brillouin zone grid batch axes.
ex, ey, ez, hx, hy, hz = [
    jnp.mean(field, axis=(0, 1)) for field in (ex, ey, ez, hx, hy, hz)
]
The following function generates the cross section of the photonic crystal permittivity so we can plot it later.
from typing import Tuple

def crystal_cross_sections(
    thickness_ambient: float,
    thickness_slab: float,
    pitch: float,
    diameter: float,
    resolution: float,
    num_unit_cells: Tuple[int, int],
) -> Tuple[jnp.ndarray, jnp.ndarray, jnp.ndarray]:
    """Computes cross sections of the photonic crystal structure."""
    mask = unit_cell_pattern(pitch, diameter, resolution)

    xy_section = jnp.tile(mask, num_unit_cells)

    xz_slab = mask[:, 0]
    xz_section = jnp.stack(
        (
            [jnp.ones_like(xz_slab)] * int(thickness_ambient / resolution)
            + [xz_slab] * int(thickness_slab / resolution)
            + [jnp.ones_like(xz_slab)] * int(thickness_ambient / resolution)
        ),
        axis=-1,
    )
    xz_section = jnp.tile(xz_section, (num_unit_cells[0], 1))

    yz_slab = mask[0, :]
    yz_section = jnp.stack(
        (
            [jnp.ones_like(yz_slab)] * int(thickness_ambient / resolution)
            + [yz_slab] * int(thickness_slab / resolution)
            + [jnp.ones_like(yz_slab)] * int(thickness_ambient / resolution)
        ),
        axis=-1,
    )
    yz_section = jnp.tile(yz_section, (num_unit_cells[1], 1))

    return xy_section, xz_section, yz_section
Finally, let's plot the field amplitude along with the contour of the photonic crystal permittivity.
from skimage import measure
import numpy as onp

section_xy, section_xz, section_yz = crystal_cross_sections(
    thickness_ambient=float(thickness_ambient),
    thickness_slab=float(thickness_slab),
    pitch=pitch,
    diameter=diameter,
    resolution=resolution,
    num_unit_cells=brillouin_grid_shape,
)

xplot, zplot = jnp.meshgrid(x, z, indexing="ij")
field_plot = ex[:, :, 0].real

plt.figure(figsize=(float(jnp.amax(xplot)), float(jnp.amax(zplot))), dpi=80)
ax = plt.subplot(111)
im = plt.pcolormesh(xplot, zplot, field_plot, shading="nearest", cmap="bwr")

im.set_clim((-float(jnp.amax(field_plot)), float(jnp.amax(field_plot))))

contours = measure.find_contours(onp.array(section_xz))
scale_factor = pitch / resolution
for c in contours:
    ax.plot(c[:, 0] / scale_factor, c[:, 1] / scale_factor, "k")

ax.axis("equal")
ax.axis("off")
ax.set_ylim(ax.get_ylim()[::-1])

plt.subplots_adjust(left=0, bottom=0, right=1, top=1)
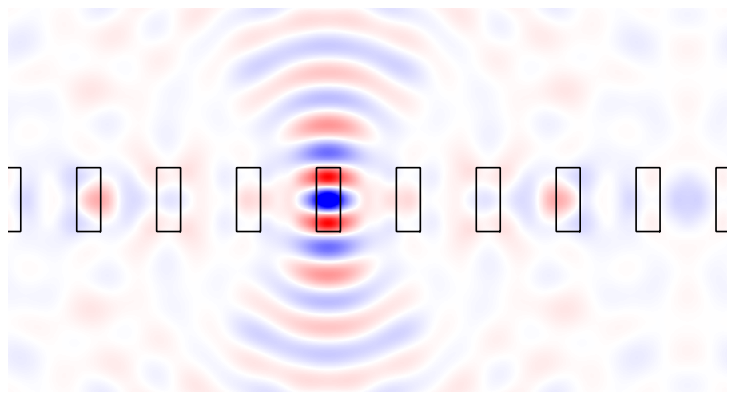
The plot above clearly shows an isolated aperiodic dipole source interacting in a periodic photonic crystal slab. This is a unique feature of the FMMAX which brings more flexibility in simulating embedded sources. Next, we will demonstrate an aperiodic gaussian beam source interacting with the photonic crystal.
Scenario 2: Gaussian beam incident on photonic crystal slab
Setting up the simulation
In this scenario, we use a gaussian beam to excite the same photonic crystal. We also use 3 wavelengths in the simulation to emulate a broadband source.
To generalize the Gaussian beam, we parameterize the polar, azimuthal, and polarization angles.
# The wavelengths, of the gaussian beam
wavelengths = jnp.asarray([0.62, 0.63, 0.64])
# The polar angle of the incident beam.
polar_angle: float = 0.15 * jnp.pi
# The azimuthal angle of the incident beam.
azimuthal_angle: float = 0.0
# The angle giving the polarization rotation about the propagation axis.
polarization_angle: float = 0.0
# The Gaussian beam waist.
beam_waist: float = 1.0
# The offset of the Gaussian beam focus from the top of the photonic crystal slab.
beam_focus_offset: float = 0.0
Brillouin zone integration creates a batch of in-plane wavevectors which are distributed throughout the first Brillouin zone. We shift the expansion so that it is centered on the direction of the incident beam. Notice now we have an extra dimension to batch in the different wavelengths.
in_plane_wavevector = basis.brillouin_zone_in_plane_wavevector(
    brillouin_grid_shape, primitive_lattice_vectors
)
wavelengths = jnp.expand_dims(jnp.atleast_1d(wavelengths), axis=(1, 2))
in_plane_wavevector += basis.plane_wave_in_plane_wavevector(
    wavelength=jnp.asarray(wavelengths),
    polar_angle=jnp.asarray(polar_angle),
    azimuthal_angle=jnp.asarray(azimuthal_angle),
    permittivity=jnp.asarray(permittivity_ambient),
)

in_plane_wavevector.shape
(3, 9, 9, 2)
Once again, we compose a partial function with immutable parameters, and solve for the eigenmodes in the photonic crystal and the ambient regions. Then, we compute the interior S-matrices.
eigensolve = functools.partial(
    fmm.eigensolve_isotropic_media,
    wavelength=jnp.asarray(wavelengths),
    in_plane_wavevector=in_plane_wavevector,
    primitive_lattice_vectors=primitive_lattice_vectors,
    expansion=expansion,
    formulation=fmm.Formulation.FFT,
)

mask = unit_cell_pattern(pitch, diameter, resolution)
permittivity_crystal = jnp.where(mask, permittivity_ambient, permittivity_slab)
solve_result_crystal = eigensolve(permittivity=permittivity_crystal)
solve_result_ambient = eigensolve(
    permittivity=jnp.asarray(permittivity_ambient)[jnp.newaxis, jnp.newaxis]
)

s_matrices_interior = scattering.stack_s_matrices_interior(
    layer_solve_results=[
        solve_result_ambient,
        solve_result_crystal,
        solve_result_ambient,
    ],
    layer_thicknesses=[thickness_ambient, thickness_slab, thickness_ambient],
)
The following snippet is a function that maps the real-space (Cartesian) location to the corresponding EM fields of a Gaussian beam. Note that it has wavelengths batched in.
def _paraxial_gaussian_field_fn(x, y, z):
    # Returns the fields of a z-propagating, x-polarized Gaussian beam.
    # See https://en.wikipedia.org/wiki/Gaussian_beam

    # Adjust array dimensions for proper batching
    wavelengths_padded = wavelengths[..., jnp.newaxis, jnp.newaxis]

    k = 2 * jnp.pi / wavelengths_padded
    z_r = (
        jnp.pi * beam_waist**2 * jnp.sqrt(permittivity_ambient) / wavelengths_padded
    )
    w_z = beam_waist * jnp.sqrt(1 + (z / z_r) ** 2)
    r = jnp.sqrt(x**2 + y**2)
    ex = (
        beam_waist
        / w_z
        * jnp.exp(-(r**2) / w_z**2)
        * jnp.exp(
            1j
            * (
                (k * z)  # Phase
                + k * r**2 / 2 * z / (z**2 + z_r**2)  # Wavefront curvature
                - jnp.arctan(z / z_r)  # Gouy phase
            )
        )
    )
    ey = jnp.zeros_like(ex)
    ez = jnp.zeros_like(ex)
    hx = jnp.zeros_like(ex)
    hy = ex / jnp.sqrt(permittivity_ambient)
    hz = jnp.zeros_like(ex)
    return (ex, ey, ez), (hx, hy, hz)
With the normal incidence parameterized, we can now rotate the Gaussian beam to our desired orientation and polarization state using a convenient function beams.shifted_rotated_fields(). We do need the real-space coordinates of the supercell which can be obtained using the basis.unit_cell_coordinates() function. Let's also visualize the rotated field.
from fmmax import beams

# Solve for the fields of the beam with the desired rotation and shift.
x, y = basis.unit_cell_coordinates(
    primitive_lattice_vectors=primitive_lattice_vectors,
    shape=permittivity_crystal.shape[-2:],  # type: ignore[arg-type]
    num_unit_cells=brillouin_grid_shape,
)
(beam_ex, beam_ey, _), (beam_hx, beam_hy, _) = beams.shifted_rotated_fields(
    field_fn=_paraxial_gaussian_field_fn,
    x=x,
    y=y,
    z=jnp.zeros_like(x),
    beam_origin_x=jnp.amax(x) / 2,
    beam_origin_y=jnp.amax(y) / 2,
    beam_origin_z=thickness_ambient - beam_focus_offset,
    polar_angle=jnp.asarray(polar_angle),
    azimuthal_angle=jnp.asarray(azimuthal_angle),
    polarization_angle=jnp.asarray(polarization_angle),
)

# Plot the beam.
plt.figure(figsize=(5,  5))
plt.title("Input Gaussian beam (Ex.imag)")
extent = (x.min(), x.max(), y.min(), y.max())
plt.xlabel("x")
plt.ylabel("y")
plt.imshow(beam_ex[0, 0, 0, ...].imag, cmap="bwr", extent=extent)
plt.show()
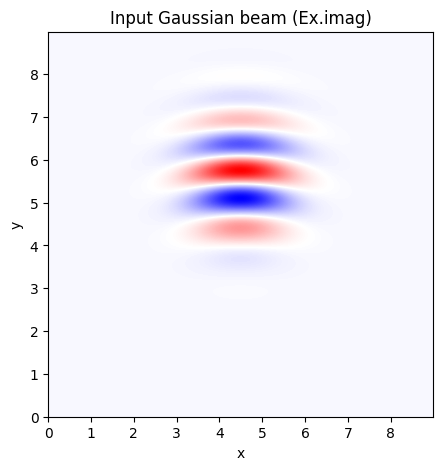
Notice that we have the excitation field in real-space coordinates. To use it in FMM, we must transform it into Fourier domain, given the shape of our supercell. We can use sources.amplitudes_for_fields() for this task. Just remember to pass in the eigensolve result of the layer that contains the field as well as the the dimension indices of the Brillouin Zone grid. Since we have a wavelength dim at 0, our M and N dims are 1 and 2.
brillouin_grid_axes = (1, 2)
# Add an additional axis for the number of sources
fwd_amplitude, _ = sources.amplitudes_for_fields(
    ex=beam_ex[..., jnp.newaxis],
    ey=beam_ey[..., jnp.newaxis],
    hx=beam_hx[..., jnp.newaxis],
    hy=beam_hy[..., jnp.newaxis],
    layer_solve_result=solve_result_ambient,
    brillouin_grid_axes=brillouin_grid_axes,
)
With the Fourier amplitudes of the fields computed, we can finally calculate the amplitudes inside each layer.
# Compute the fields inside the structure.
amplitudes_interior = fields.stack_amplitudes_interior(
    s_matrices_interior=s_matrices_interior,
    forward_amplitude_0_start=fwd_amplitude,
    backward_amplitude_N_end=jnp.zeros_like(fwd_amplitude),
)
Brillouin Zone Integration and Visualization
With that, let's begin the postprocessing steps to convert back to the real-space for visualization.
# Coordinates where fields are to be evaluated.
x = jnp.arange(0, pitch * brillouin_grid_shape[0], resolution_fields)
y = jnp.ones_like(x) * pitch * brillouin_grid_shape[1] / 2
(ex, ey, ez), (hx, hy, hz), (x, y, z) = fields.stack_fields_3d_on_coordinates(
    amplitudes_interior=amplitudes_interior,
    layer_solve_results=[
        solve_result_ambient,
        solve_result_crystal,
        solve_result_ambient,
    ],
    layer_thicknesses=[
        thickness_ambient,
        thickness_slab,
        thickness_ambient,
    ],
    layer_znum=[
        int(thickness_ambient / resolution_fields),
        int(thickness_slab / resolution_fields),
        int(thickness_ambient / resolution_fields),
    ],
    x=x,
    y=y,
)
Just like before, we can now perform the Brillouin zone integration by averaging over the Brillouin zone grid batch axes.
ex, ey, ez, hx, hy, hz = [
    jnp.mean(field, axis=brillouin_grid_axes) for field in (ex, ey, ez, hx, hy, hz)
]
Finally, we visualize the BZ averaged fields for each wavelength.
# Compute some cross sections for visualizing the structure.
section_xy, section_xz, section_yz = crystal_cross_sections(
    thickness_ambient=float(thickness_ambient),
    thickness_slab=float(thickness_slab),
    pitch=pitch,
    diameter=diameter,
    resolution=resolution,
    num_unit_cells=brillouin_grid_shape,
)

for wavelength_idx in range(3):
    xplot, zplot = jnp.meshgrid(x, z, indexing="ij")
    field_plot = ex[wavelength_idx, :, :, 0].real

    plt.figure(figsize=(float(jnp.amax(xplot)), float(jnp.amax(zplot))), dpi=80)
    plt.title("Wavelength = " + str(wavelengths[wavelength_idx, 0, 0]))
    ax = plt.subplot(111)
    im = plt.pcolormesh(xplot, zplot, field_plot, shading="nearest", cmap="bwr")

    im.set_clim((-float(jnp.amax(field_plot)), float(jnp.amax(field_plot))))

    contours = measure.find_contours(onp.array(section_xz))
    scale_factor = pitch / resolution
    for c in contours:
        ax.plot(c[:, 0] / scale_factor, c[:, 1] / scale_factor, "k")

    ax.axis("equal")
    ax.axis("off")
    ax.set_ylim(ax.get_ylim()[::-1])

    plt.subplots_adjust(left=0, bottom=0, right=1, top=1)
    plt.show()
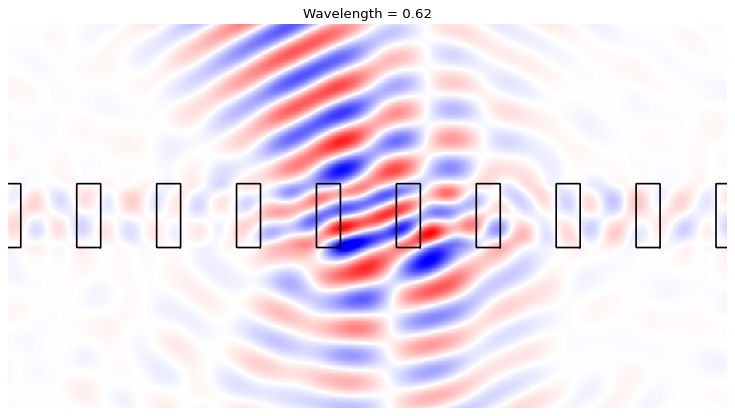
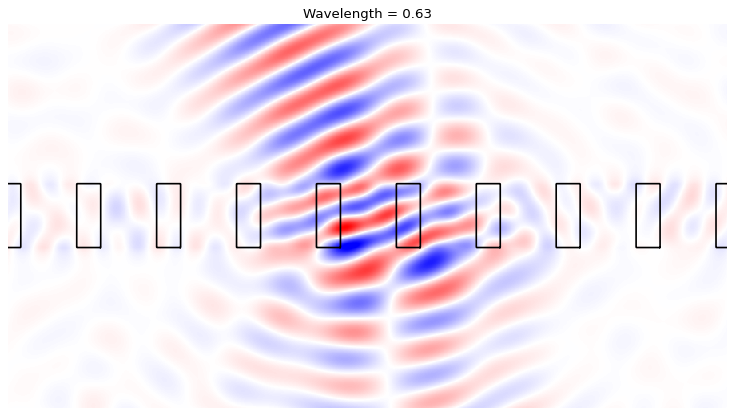
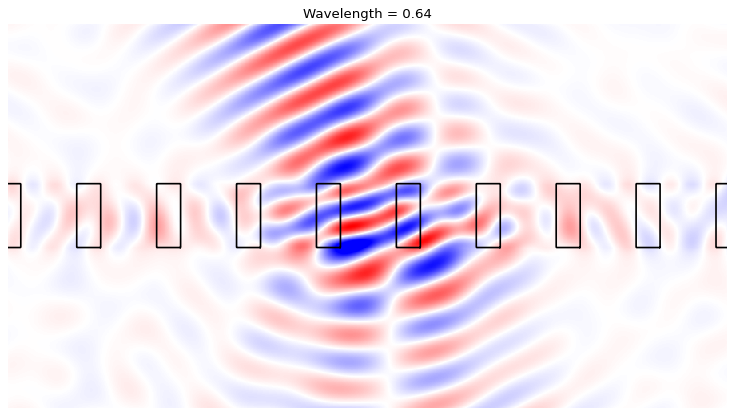
We can clearly see a Gaussian beam with an incidence angle of 15°. The photonic crystal clearly modulates he incident Gaussian. We also observe some transversely coupled fields in the photonic crystal.