Performance analysis
This example shows how to collect runtime performance statistics using custom hooks and then export the data to a database.
Note
To learn how to interpret the performance statistics, please refer to Optimization Guide.
The Pipeline class can collect runtime statistics
and periodically publish them via hooks and queues.
This example shows how to use a buffer-based logging pattern with
SQLite as the storage backend to collect and query performance statistics.
The performance stats are exposed as spdl.pipeline.TaskPerfStats and
spdl.pipeline.QueuePerfStats classes. These are collected via hooks
and queues into a shared buffer, which is then asynchronously written
to a SQLite database by a dedicated writer thread.
Architecture
The following diagram illustrates the relationship between the pipeline, buffer, and writer thread:
Example Usage
This example demonstrates:
Using
TaskStatsHookWithLoggingto log task performance to a bufferUsing
StatsQueueWithLoggingto log queue performance to a bufferUsing
SQLiteStatsWriterto asynchronously flush the buffer to SQLite
Running this example on Kinetics K400 dataset produces the following output:
================================================================================
PIPELINE PERFORMANCE SUMMARY
================================================================================
📊 Task Statistics:
--------------------------------------------------------------------------------
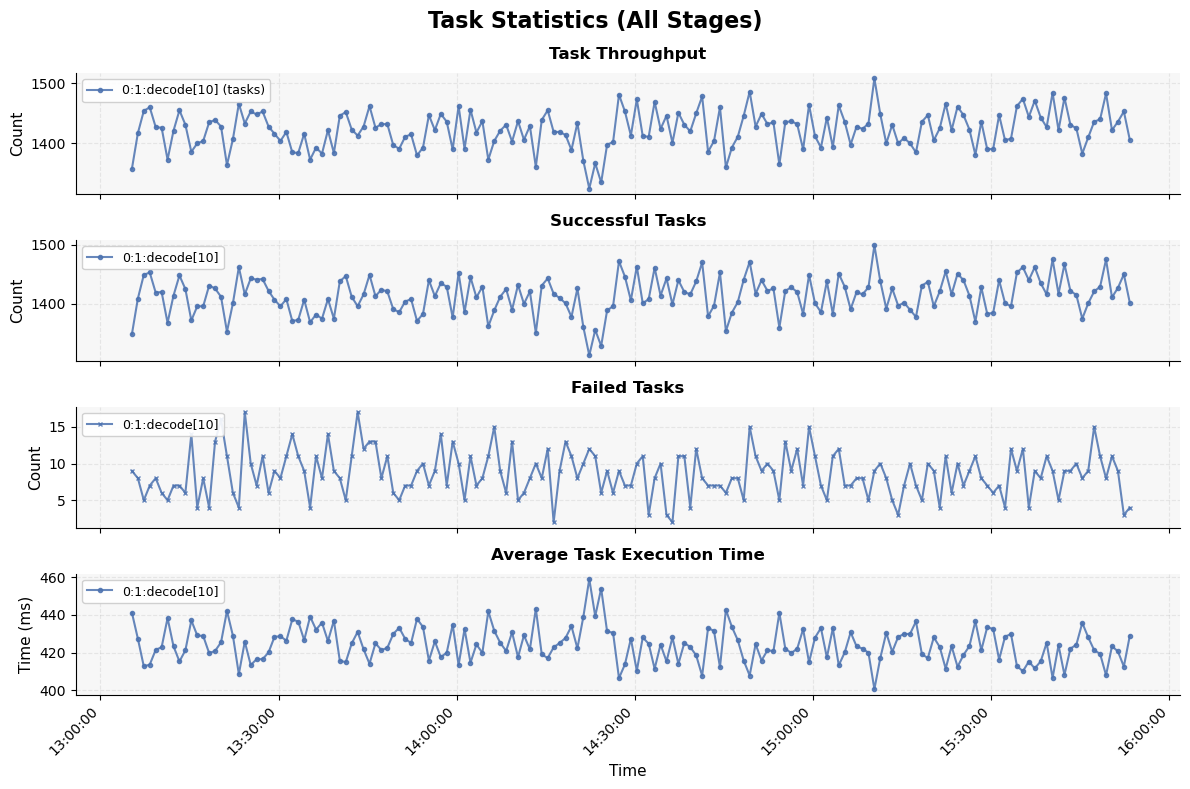
Stage: 0:1:decode[10]
Total tasks processed: 240435
Total failures: 1458
Average task time: 0.4241s
Success rate: 99.4%
Number of log entries: 169
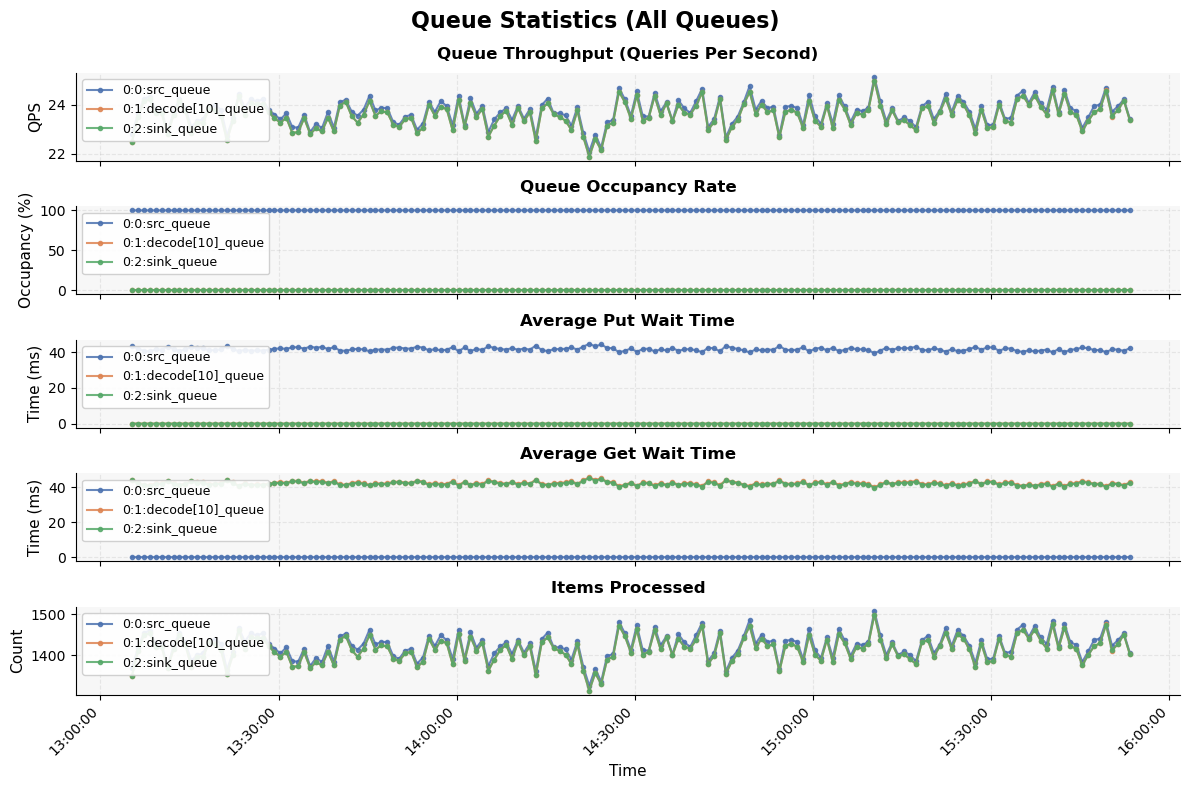
📈 Queue Statistics:
--------------------------------------------------------------------------------
Queue: 0:0:src_queue
Total items processed: 240445
Average QPS: 23.71
Average put time: 0.0417s
Average get time: 0.0000s
Average occupancy rate: 100.0%
Number of log entries: 169
Queue: 0:1:decode[10]_queue
Total items processed: 238977
Average QPS: 23.57
Average put time: 0.0000s
Average get time: 0.0424s
Average occupancy rate: 0.1%
Number of log entries: 169
Queue: 0:2:sink_queue
Total items processed: 238977
Average QPS: 23.57
Average put time: 0.0000s
Average get time: 0.0421s
Average occupancy rate: 0.1%
Number of log entries: 169
Visualization
The SQLite database can be queried using standard SQL tools or the built-in query API to analyze:
Task execution times and failure rates
Queue throughput (QPS) and occupancy rates
Pipeline bottlenecks and resource utilization
You can use the performance_analysis_plot.py script to query the data from
the database and generate plots for visualization and analysis.
Source
Source
Click here to see the source.
  1#!/usr/bin/env python3
  2# Copyright (c) Meta Platforms, Inc. and affiliates.
  3# All rights reserved.
  4#
  5# This source code is licensed under the BSD-style license found in the
  6# LICENSE file in the root directory of this source tree.
  7
  8"""This example shows how to collect runtime performance statistics using
  9custom hooks and then export the data to a database.
 10
 11.. note::
 12
 13   To learn how to interpret the performance statistics, please refer to
 14   :doc:`../optimization_guide/index`.
 15
 16The :py:class:`~spdl.pipeline.Pipeline` class can collect runtime statistics
 17and periodically publish them via hooks and queues.
 18This example shows how to use a buffer-based logging pattern with
 19SQLite as the storage backend to collect and query performance statistics.
 20
 21The performance stats are exposed as :py:class:`spdl.pipeline.TaskPerfStats` and
 22:py:class:`spdl.pipeline.QueuePerfStats` classes. These are collected via hooks
 23and queues into a shared buffer, which is then asynchronously written
 24to a SQLite database by a dedicated writer thread.
 25
 26Architecture
 27------------
 28
 29The following diagram illustrates the relationship between the pipeline, buffer,
 30and writer thread:
 31
 32.. mermaid::
 33
 34   graph LR
 35       subgraph Pipeline
 36           A[Task Hooks]
 37           C[Queues]
 38       end
 39       A -->|Task Stats| B[Shared Buffer]
 40       C -->|Queue Stats| B
 41       D[GC Events] -->|Event Logs| B
 42       B -->|Async Write| E[Writer Thread]
 43       E -->|Persist| F[(SQLite Database)]
 44       F -->|Query| G[performance_analysis_plot.py]
 45
 46Example Usage
 47-------------
 48
 49This example demonstrates:
 50
 51#. Using :py:class:`TaskStatsHookWithLogging` to log task performance to a buffer
 52#. Using :py:class:`StatsQueueWithLogging` to log queue performance to a buffer
 53#. Using :py:class:`SQLiteStatsWriter` to asynchronously flush the buffer to SQLite
 54
 55Running this example on Kinetics K400 dataset produces the following output:
 56
 57.. code-block:: text
 58
 59   ================================================================================
 60   PIPELINE PERFORMANCE SUMMARY
 61   ================================================================================
 62   📊 Task Statistics:
 63   --------------------------------------------------------------------------------
 64
 65     Stage: 0:1:decode[10]
 66       Total tasks processed: 240435
 67       Total failures: 1458
 68       Average task time: 0.4241s
 69       Success rate: 99.4%
 70       Number of log entries: 169
 71
 72   📈 Queue Statistics:
 73   --------------------------------------------------------------------------------
 74
 75     Queue: 0:0:src_queue
 76       Total items processed: 240445
 77       Average QPS: 23.71
 78       Average put time: 0.0417s
 79       Average get time: 0.0000s
 80       Average occupancy rate: 100.0%
 81       Number of log entries: 169
 82
 83     Queue: 0:1:decode[10]_queue
 84       Total items processed: 238977
 85       Average QPS: 23.57
 86       Average put time: 0.0000s
 87       Average get time: 0.0424s
 88       Average occupancy rate: 0.1%
 89       Number of log entries: 169
 90
 91     Queue: 0:2:sink_queue
 92       Total items processed: 238977
 93       Average QPS: 23.57
 94       Average put time: 0.0000s
 95       Average get time: 0.0421s
 96       Average occupancy rate: 0.1%
 97       Number of log entries: 169
 98
 99Visualization
100-------------
101
102The SQLite database can be queried using standard SQL tools or the
103built-in query API to analyze:
104
105- Task execution times and failure rates
106- Queue throughput (QPS) and occupancy rates
107- Pipeline bottlenecks and resource utilization
108
109You can use the ``performance_analysis_plot.py`` script to query the data from
110the database and generate plots for visualization and analysis.
111
112.. image:: ../_static/data/example-performance-analysis-task-stats.png
113
114.. image:: ../_static/data/example-performance-analysis-queue-stats.png
115
116"""
117
118import argparse
119import gc
120import logging
121import time
122from collections.abc import Iterable
123from functools import partial
124from pathlib import Path
125from queue import Queue
126
127import spdl.io
128import torch
129from spdl.pipeline import (
130    Pipeline,
131    PipelineBuilder,
132    QueuePerfStats,
133    StageInfo,
134    StatsQueue,
135    TaskHook,
136    TaskPerfStats,
137    TaskStatsHook,
138)
139
140try:
141    from examples.sqlite_stats_logger import (  # pyre-ignore[21]
142        EventLogEntry,
143        log_stats_summary,
144        QueueStatsLogEntry,
145        SQLiteStatsWriter,
146        TaskStatsLogEntry,
147    )
148except ImportError:
149    from spdl.examples.sqlite_stats_logger import (
150        EventLogEntry,
151        log_stats_summary,
152        QueueStatsLogEntry,
153        SQLiteStatsWriter,
154        TaskStatsLogEntry,
155    )
156
157
158__all__ = [
159    "parse_args",
160    "main",
161    "build_pipeline",
162    "decode",
163    "TaskStatsHookWithLogging",
164    "StatsQueueWithLogging",
165    "SQLiteStatsWriter",
166]
167
168# pyre-strict
169
170_LG: logging.Logger = logging.getLogger(__name__)
171
172
173class TaskStatsHookWithLogging(TaskStatsHook):
174    """Task hook that logs statistics to a shared buffer.
175
176    This hook collects task performance statistics and writes them to a
177    plain Python queue.
178
179    Args:
180        info: The stage identity.
181        buffer: Shared queue to write stats entries. This queue is typically
182            consumed by a separate writer (e.g., ``SQLiteStatsWriter``).
183        interval: The interval (in seconds) to report the performance stats
184            periodically.
185    """
186
187    def __init__(
188        self,
189        info: StageInfo,
190        buffer: Queue[TaskStatsLogEntry | QueueStatsLogEntry | EventLogEntry],
191        interval: float = 59,
192    ) -> None:
193        super().__init__(info, interval=interval)
194        self._buffer = buffer
195
196    async def interval_stats_callback(self, stats: TaskPerfStats) -> None:
197        """Log interval statistics to the buffer."""
198        await super().interval_stats_callback(stats)
199
200        entry = TaskStatsLogEntry(
201            timestamp=time.time(),
202            name=str(self.info),
203            stats=stats,
204        )
205        self._buffer.put(entry)
206
207
208class StatsQueueWithLogging(StatsQueue):
209    """Queue that logs statistics to a shared buffer.
210
211    This queue collects queue performance statistics and writes them to a
212    plain Python queue.
213
214    Args:
215        info: The stage identity. Assigned by PipelineBuilder.
216        buffer: Shared queue to write stats entries. This queue is typically
217            consumed by a separate writer (e.g., ``SQLiteStatsWriter``).
218        buffer_size: The buffer size. Assigned by PipelineBuilder.
219        interval: The interval (in seconds) to report the performance stats
220            periodically.
221    """
222
223    def __init__(
224        self,
225        info: StageInfo,
226        buffer: Queue[TaskStatsLogEntry | QueueStatsLogEntry | EventLogEntry],
227        buffer_size: int = 1,
228        interval: float = 59,
229    ) -> None:
230        super().__init__(info, buffer_size=buffer_size, interval=interval)
231        self._buffer = buffer
232
233    async def interval_stats_callback(self, stats: QueuePerfStats) -> None:
234        """Log interval statistics to the buffer."""
235        await super().interval_stats_callback(stats)
236
237        entry = QueueStatsLogEntry(
238            timestamp=time.time(),
239            name=str(self.info),
240            stats=stats,
241        )
242        self._buffer.put(entry)
243
244
245def parse_args() -> argparse.Namespace:
246    """Parse command line arguments."""
247    parser = argparse.ArgumentParser(
248        description=__doc__,
249    )
250    parser.add_argument(
251        "--dataset-dir",
252        type=Path,
253        required=True,
254        help="Directory containing video files (*.mp4)",
255    )
256    parser.add_argument(
257        "--db-path",
258        type=Path,
259        default=Path("pipeline_stats.db"),
260        help="Path to SQLite database for stats (default: pipeline_stats.db)",
261    )
262    parser.add_argument(
263        "--log-interval",
264        type=float,
265        default=60,
266        help="Interval in seconds for logging stats to database (default: 60)",
267    )
268    parser.add_argument(
269        "--concurrency",
270        type=int,
271        default=10,
272        help="Number of concurrent decoding tasks (default: 10)",
273    )
274    return parser.parse_args()
275
276
277def decode(path: Path, width: int = 128, height: int = 128) -> torch.Tensor:
278    """Decode the video from the given path with rescaling.
279
280    Args:
281        path: The path to the video file.
282        width,height: The resolution of video after rescaling.
283
284    Returns:
285        Uint8 tensor in shape of ``[N, C, H, W]``: Video frames in Tensor.
286    """
287    packets = spdl.io.demux_video(path)
288    frames = spdl.io.decode_packets(
289        packets,
290        filter_desc=spdl.io.get_filter_desc(
291            packets,
292            scale_width=width,
293            scale_height=height,
294            pix_fmt="rgb24",
295        ),
296    )
297    buffer = spdl.io.convert_frames(frames)
298    return spdl.io.to_torch(buffer).permute(0, 2, 3, 1)
299
300
301def build_pipeline(
302    source: Iterable[Path],
303    log_interval: float,
304    concurrency: int,
305    buffer: Queue[TaskStatsLogEntry | QueueStatsLogEntry | EventLogEntry],
306) -> Pipeline:
307    """Build the pipeline with stats logging to a buffer.
308
309    Args:
310        source: A data source containing video file paths.
311        log_interval: The interval (in seconds) the performance data is saved.
312        concurrency: The concurrency for video decoding.
313        buffer: Shared queue for collecting stats entries. This queue should
314            be consumed by a ``SQLiteStatsWriter`` instance.
315
316    Returns:
317        A configured Pipeline instance ready for execution.
318    """
319
320    def hook_factory(info: StageInfo) -> list[TaskHook]:
321        return [
322            TaskStatsHookWithLogging(
323                info,
324                buffer=buffer,
325                interval=log_interval,
326            )
327        ]
328
329    return (
330        PipelineBuilder()
331        .add_source(source=source)
332        .pipe(decode, concurrency=concurrency)
333        .add_sink()
334        .build(
335            num_threads=concurrency,
336            queue_class=partial(  # pyre-ignore[6]
337                StatsQueueWithLogging,
338                buffer=buffer,
339                interval=log_interval,
340            ),
341            task_hook_factory=hook_factory,
342        )
343    )
344
345
346def _validate_dataset(dataset_dir: Path) -> list[Path]:
347    """Validate dataset directory and return list of video files.
348
349    Args:
350        dataset_dir: Path to the dataset directory.
351
352    Returns:
353        List of video file paths.
354
355    Raises:
356        ValueError: If the directory doesn't exist or contains no videos.
357    """
358    if not dataset_dir.exists():
359        raise ValueError(f"Dataset directory does not exist: {dataset_dir}")
360
361    video_files = list(dataset_dir.rglob("*.mp4"))
362    if not video_files:
363        raise ValueError(f"No *.mp4 files found in {dataset_dir}")
364
365    return video_files
366
367
368def setup_gc_callbacks(
369    buffer: Queue[TaskStatsLogEntry | QueueStatsLogEntry | EventLogEntry],
370) -> None:
371    """Set up garbage collection callbacks to log GC events.
372
373    Args:
374        buffer: Shared queue for collecting stats entries.
375    """
376
377    def gc_callback(phase: str, _info: dict[str, int]) -> None:
378        """Callback invoked during garbage collection phases.
379
380        Args:
381            phase: The GC phase ('start' or 'stop').
382            _info: Dictionary containing GC information (unused).
383        """
384        event_name = f"gc_{phase}"
385        entry = EventLogEntry(
386            timestamp=time.time(),
387            event_name=event_name,
388        )
389        buffer.put(entry)
390        _LG.debug("GC event logged: %s", event_name)
391
392    # Register the callback with the garbage collector
393    gc.callbacks.append(gc_callback)
394    _LG.info("Garbage collection callbacks registered")
395
396
397def main() -> None:
398    """The main entry point for the example."""
399    logging.basicConfig(
400        level=logging.INFO,
401        format="%(asctime)s [%(levelname).1s]: %(message)s",
402    )
403
404    args = parse_args()
405
406    # Validate dataset and get video files
407    video_files = _validate_dataset(args.dataset_dir)
408
409    print("\n🎬 Starting video processing pipeline")
410    print(f"   Dataset: {args.dataset_dir}")
411    print(f"   Videos found: {len(video_files)}")
412    print(f"   Database: {args.db_path}")
413    print(f"   Concurrency: {args.concurrency}")
414    print(f"   Log interval: {args.log_interval}s\n")
415    print("", flush=True)
416
417    # Create shared buffer and writer
418    buffer: Queue[TaskStatsLogEntry | QueueStatsLogEntry | EventLogEntry] = Queue()
419    writer = SQLiteStatsWriter(
420        str(args.db_path),
421        buffer,
422        flush_interval=max(0.1, args.log_interval - 1),
423    )
424    writer.start()
425
426    # Set up garbage collection callbacks
427    setup_gc_callbacks(buffer)
428
429    # Build and run pipeline
430    pipeline = build_pipeline(
431        source=video_files,
432        log_interval=args.log_interval,
433        concurrency=args.concurrency,
434        buffer=buffer,
435    )
436
437    try:
438        start_time = time.monotonic()
439        with pipeline.auto_stop():
440            for _ in pipeline:
441                pass
442
443        elapsed = time.monotonic() - start_time
444        print(f"\n✅ Pipeline completed in {elapsed:.2f} seconds")
445
446    finally:
447        # Ensure all stats are flushed to database
448        writer.shutdown()
449
450        # Log stats summary
451        log_stats_summary(args.db_path)
452
453
454if __name__ == "__main__":
455    main()
API Reference
Functions
- build_pipeline(source: Iterable[Path], log_interval: float, concurrency: int, buffer: Queue[TaskStatsLogEntry | QueueStatsLogEntry | EventLogEntry]) Pipeline[source]
Build the pipeline with stats logging to a buffer.
- Parameters:
source – A data source containing video file paths.
log_interval – The interval (in seconds) the performance data is saved.
concurrency – The concurrency for video decoding.
buffer – Shared queue for collecting stats entries. This queue should be consumed by a
SQLiteStatsWriterinstance.
- Returns:
A configured Pipeline instance ready for execution.
- decode(path: Path, width: int = 128, height: int = 128) Tensor[source]
Decode the video from the given path with rescaling.
- Parameters:
path – The path to the video file.
width – The resolution of video after rescaling.
height – The resolution of video after rescaling.
- Returns:
Video frames in Tensor.
- Return type:
Uint8 tensor in shape of
[N, C, H, W]
Classes
- class TaskStatsHookWithLogging(info: StageInfo, buffer: Queue[TaskStatsLogEntry | QueueStatsLogEntry | EventLogEntry], interval: float = 59)[source]
Task hook that logs statistics to a shared buffer.
This hook collects task performance statistics and writes them to a plain Python queue.
- Parameters:
info – The stage identity.
buffer – Shared queue to write stats entries. This queue is typically consumed by a separate writer (e.g.,
SQLiteStatsWriter).interval – The interval (in seconds) to report the performance stats periodically.
- async interval_stats_callback(stats: TaskPerfStats) None[source]
Log interval statistics to the buffer.
- class StatsQueueWithLogging(info: StageInfo, buffer: Queue[TaskStatsLogEntry | QueueStatsLogEntry | EventLogEntry], buffer_size: int = 1, interval: float = 59)[source]
Queue that logs statistics to a shared buffer.
This queue collects queue performance statistics and writes them to a plain Python queue.
- Parameters:
info – The stage identity. Assigned by PipelineBuilder.
buffer – Shared queue to write stats entries. This queue is typically consumed by a separate writer (e.g.,
SQLiteStatsWriter).buffer_size – The buffer size. Assigned by PipelineBuilder.
interval – The interval (in seconds) to report the performance stats periodically.
- async interval_stats_callback(stats: QueuePerfStats) None[source]
Log interval statistics to the buffer.
- class SQLiteStatsWriter(db_path: str, buffer: Queue[TaskStatsLogEntry | QueueStatsLogEntry | EventLogEntry], flush_interval: float)[source]
Background writer thread for flushing statistics to SQLite.
This class manages a background thread that periodically flushes statistics from a shared queue to a SQLite database. It’s designed to be decoupled from the hooks and queues that populate the buffer, allowing flexibility in changing storage backends.
The writer uses a periodic flushing strategy: - Wakes up at regular intervals (configured by flush_interval) - Drains all entries from the queue - Flushes to database if any entries were collected - Repeats until shutdown
- Thread Safety:
Uses queue.Queue which provides built-in thread safety for producer-consumer patterns.
- Parameters:
db_path – Path to the SQLite database file. The database schema will be initialized if it doesn’t exist.
buffer – Shared queue that serves as the buffer for log entries. This buffer is populated by hooks/queues and consumed by this writer.
flush_interval – Duration in seconds to sleep between queue drain cycles. Lower values increase CPU usage but reduce latency.
Example
>>> from queue import Queue
>>> buffer: Queue[TaskStatsLogEntry | QueueStatsLogEntry] = Queue()
>>> writer = SQLiteStatsWriter("stats.db", buffer)
>>> writer.start()  # Start background thread
>>> # ... hooks populate buffer ...
>>> writer.shutdown()  # Flush remaining entries and stop thread