Pipeline profiling
Example demonstrating the use of spdl.pipeline.profile_pipeline().
The profile_pipeline() function allows you to benchmark your pipeline
stages independently across different concurrency levels to identify optimal
performance settings. This is particularly useful when tuning pipeline performance
before deploying to production.
This example shows how to:
Create a simple pipeline with multiple processing stages
Use
profile_pipeline()to benchmark each stageAnalyze the profiling results to identify performance bottlenecks
Use a custom callback to process results as they are generated
Visualize performance results with a plot
This example generates an figure like the following.
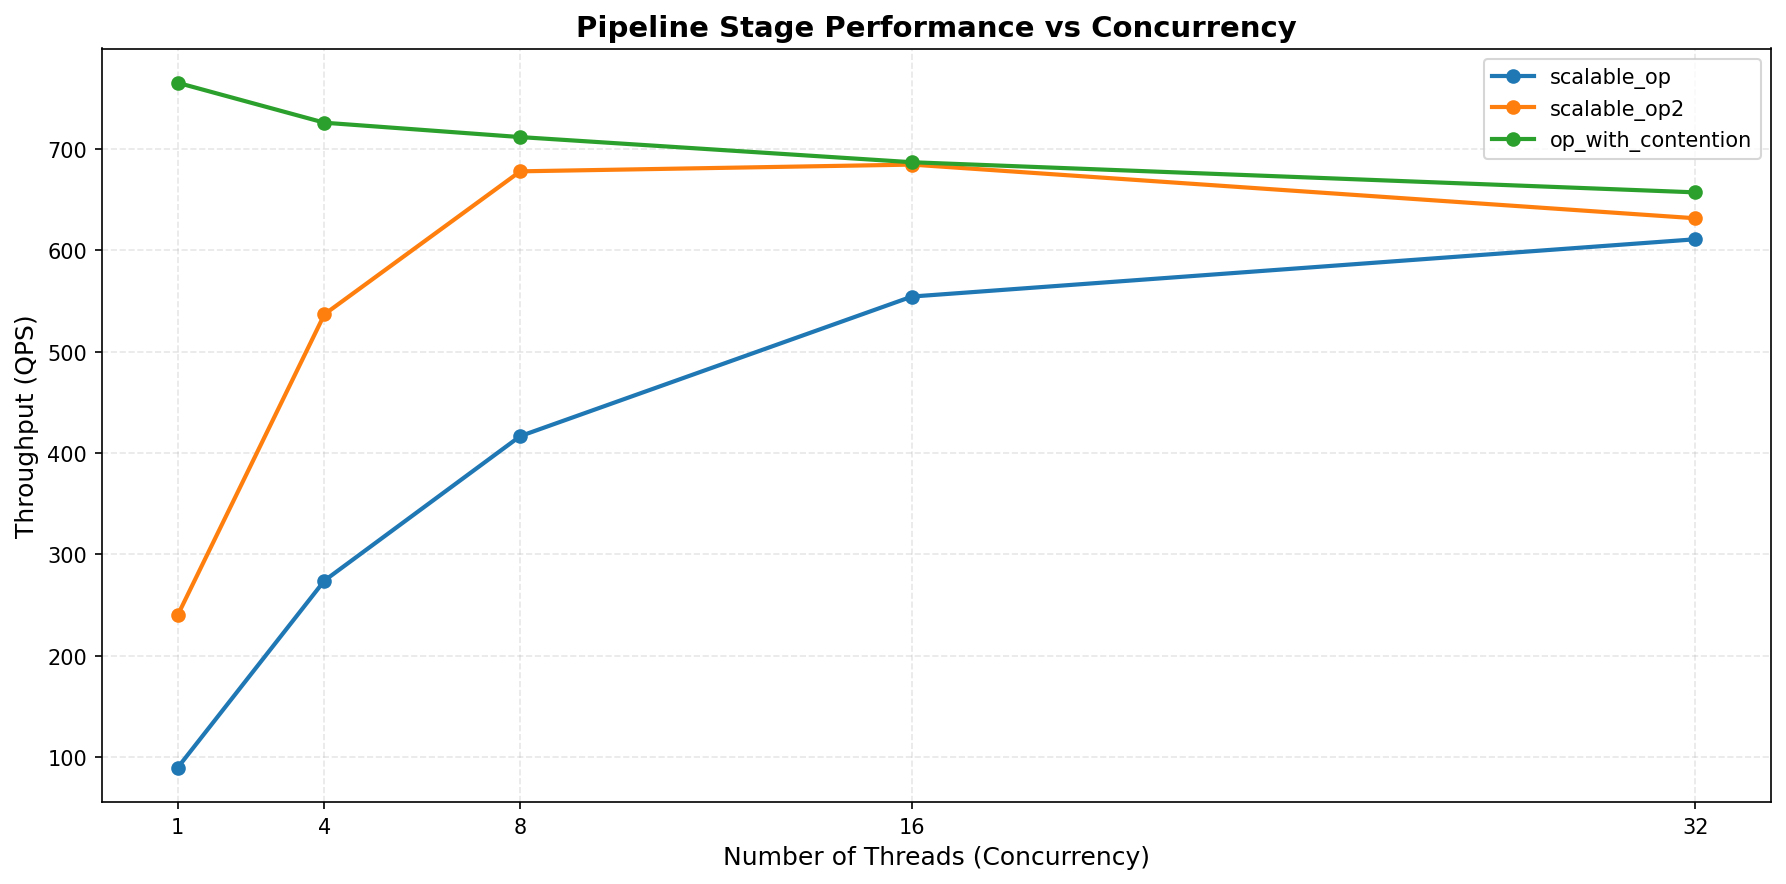
If a function is time-consuming like networking or performing,
as long as the GIL is released, the performance improves with more threads.
("scalable_op" and "scalable_op2").
The function might be constrained by other factors such as CPU resource,
and it can hit the peak performance at some point. ("scalable_op2")
If the function holds the GIL completely, the performance peaks at single
concurrency, and it degrades as more threads are added. ("op_with_contention")
Source
Source
Click here to see the source.
  1#!/usr/bin/env python3
  2# Copyright (c) Meta Platforms, Inc. and affiliates.
  3# All rights reserved.
  4#
  5# This source code is licensed under the BSD-style license found in the
  6# LICENSE file in the root directory of this source tree.
  7
  8"""Example demonstrating the use of :py:func:`spdl.pipeline.profile_pipeline`.
  9
 10The :py:func:`~spdl.pipeline.profile_pipeline` function allows you to benchmark your pipeline
 11stages independently across different concurrency levels to identify optimal
 12performance settings. This is particularly useful when tuning pipeline performance
 13before deploying to production.
 14
 15This example shows how to:
 16
 171. Create a simple pipeline with multiple processing stages
 182. Use :py:func:`~spdl.pipeline.profile_pipeline` to benchmark each stage
 193. Analyze the profiling results to identify performance bottlenecks
 204. Use a custom callback to process results as they are generated
 215. Visualize performance results with a plot
 22
 23This example generates an figure like the following.
 24
 25.. image:: ../../_static/data/profile_pipeline_example.png
 26
 27If a function is time-consuming like networking or performing,
 28as long as the GIL is released, the performance improves with more threads.
 29(``"scalable_op"`` and ``"scalable_op2"``).
 30
 31The function might be constrained by other factors such as CPU resource,
 32and it can hit the peak performance at some point. (``"scalable_op2"``)
 33
 34If the function holds the GIL completely, the performance peaks at single
 35concurrency, and it degrades as more threads are added. (``"op_with_contention"``)
 36"""
 37
 38import argparse
 39import logging
 40import time
 41from collections.abc import Sequence
 42from pathlib import Path
 43
 44from spdl.pipeline import profile_pipeline, ProfileResult
 45from spdl.pipeline.defs import Pipe, PipelineConfig, SinkConfig, SourceConfig
 46
 47__all__ = [
 48    "parse_args",
 49    "main",
 50    "scalable_op",
 51    "scalable_op2",
 52    "op_with_contention",
 53    "create_pipeline",
 54    "print_profile_result",
 55    "plot_profile_results",
 56    "run_profiling_example",
 57]
 58
 59# pyre-strict
 60
 61_LG: logging.Logger = logging.getLogger(__name__)
 62
 63
 64def parse_args() -> argparse.Namespace:
 65    """Parse command line arguments."""
 66    parser = argparse.ArgumentParser(
 67        description=__doc__,
 68        formatter_class=argparse.RawDescriptionHelpFormatter,
 69    )
 70    parser.add_argument(
 71        "--num-inputs",
 72        type=int,
 73        default=500,
 74        help="Number of inputs to use for profiling each stage",
 75    )
 76    parser.add_argument(
 77        "--plot-output",
 78        type=Path,
 79        help="Path to save the performance plot (e.g., profile_results.png)",
 80    )
 81    return parser.parse_args()
 82
 83
 84def scalable_op(x: int) -> int:
 85    """Simulate an operation which releases the GIL most of the time.
 86
 87    Args:
 88        x: Input integer
 89
 90    Returns:
 91        The input value multiplied by 2
 92    """
 93    time.sleep(0.01)
 94    return x * 2
 95
 96
 97def scalable_op2(x: int) -> int:
 98    """Simulate an operation which releases the GIL some time.
 99
100    Args:
101        x: Input integer
102
103    Returns:
104        The input value plus 100
105    """
106    time.sleep(0.003)
107    return x + 100
108
109
110def op_with_contention(x: int) -> int:
111    """Simulate an operation holds the GIL.
112
113    Args:
114        x: Input integer
115
116    Returns:
117        The input value squared
118    """
119    return x**2
120
121
122def create_pipeline(num_sources: int = 1000) -> PipelineConfig[int, int]:
123    """Create a pipeline configuration with multiple stages.
124
125    Args:
126        num_sources: Number of source items to generate
127
128    Returns:
129        Pipeline configuration with three processing stages
130    """
131    return PipelineConfig(
132        src=SourceConfig(range(num_sources)),
133        pipes=[
134            Pipe(scalable_op),
135            Pipe(scalable_op2),
136            Pipe(op_with_contention),
137        ],
138        sink=SinkConfig(buffer_size=10),
139    )
140
141
142def print_profile_result(result: ProfileResult) -> None:
143    """Print profiling result in a formatted way.
144
145    This is a callback function that will be called after each stage is profiled.
146
147    Args:
148        result: Profiling result for a single stage
149    """
150    _LG.info("=" * 60)
151    _LG.info("Stage: %s", result.name)
152    _LG.info("-" * 60)
153
154    for stat in result.stats:
155        _LG.info(
156            "Concurrency %2d: QPS=%8.2f, Occupancy=%5.1f%%",
157            stat.concurrency,
158            stat.qps,
159            stat.occupancy_rate * 100,
160        )
161
162    best_stat = max(result.stats, key=lambda s: s.qps)
163    _LG.info("-" * 60)
164    _LG.info(
165        "Best Performance: Concurrency=%d, QPS=%.2f",
166        best_stat.concurrency,
167        best_stat.qps,
168    )
169    _LG.info("=" * 60)
170
171
172def plot_profile_results(
173    results: Sequence[ProfileResult], output_path: Path | None = None
174) -> None:
175    """Plot profiling results showing QPS vs concurrency for each stage.
176
177    Args:
178        results: List of profiling results for each pipeline stage
179        output_path: Optional path to save the plot. If None, displays the plot.
180    """
181    import matplotlib.pyplot as plt
182
183    plt.figure(figsize=(12, 6))
184
185    all_concurrencies = set()
186    for result in results:
187        concurrencies = [stat.concurrency for stat in result.stats]
188        qps_values = [stat.qps for stat in result.stats]
189        plt.plot(concurrencies, qps_values, marker="o", linewidth=2, label=result.name)
190        all_concurrencies.update(concurrencies)
191
192    sorted_concurrencies = sorted(all_concurrencies, reverse=True)
193    plt.xticks(sorted_concurrencies, [str(c) for c in sorted_concurrencies])
194
195    plt.xlabel("Number of Threads (Concurrency)", fontsize=12)
196    plt.ylabel("Throughput (QPS)", fontsize=12)
197    plt.title(
198        "Pipeline Stage Performance vs Concurrency", fontsize=14, fontweight="bold"
199    )
200    plt.legend(loc="best", fontsize=10)
201    plt.grid(True, alpha=0.3, linestyle="--")
202    plt.tight_layout()
203
204    if output_path:
205        plt.savefig(output_path, dpi=150, bbox_inches="tight")
206        _LG.info("Plot saved to: %s", output_path)
207    else:
208        plt.show()
209
210
211def run_profiling_example(num_inputs: int = 500) -> Sequence[ProfileResult]:
212    """Run the profiling example.
213
214    Args:
215        num_inputs: Number of inputs to use for profiling
216
217    Returns:
218        List of profiling results for each stage
219    """
220    _LG.info("Creating pipeline configuration...")
221    pipeline_config = create_pipeline(num_sources=num_inputs * 2)
222
223    _LG.info("Starting pipeline profiling with %d inputs...", num_inputs)
224    _LG.info("This will benchmark each stage at different concurrency levels.")
225
226    results = profile_pipeline(
227        pipeline_config,
228        num_inputs=num_inputs,
229        callback=print_profile_result,
230    )
231
232    _LG.info("Profiling complete!")
233    _LG.info("Total stages profiled: %d", len(results))
234
235    return results
236
237
238def main() -> None:
239    """Main entry point demonstrating profile_pipeline usage."""
240    logging.basicConfig(
241        level=logging.INFO,
242        format="%(asctime)s [%(levelname)s] %(message)s",
243    )
244
245    args = parse_args()
246
247    _LG.info("Profile Pipeline Example")
248    _LG.info("=" * 60)
249
250    results = run_profiling_example(num_inputs=args.num_inputs)
251
252    _LG.info("\nSummary of Best Performance per Stage:")
253    _LG.info("=" * 60)
254    for result in results:
255        best_stat = max(result.stats, key=lambda s: s.qps)
256        _LG.info(
257            "%-20s: Best at concurrency=%2d (QPS=%.2f)",
258            result.name,
259            best_stat.concurrency,
260            best_stat.qps,
261        )
262
263    if args.plot_output or True:
264        _LG.info("\nGenerating performance plot...")
265        plot_profile_results(results, args.plot_output)
266
267
268if __name__ == "__main__":
269    main()
Functions
Functions
- scalable_op(x: int) int[source]
Simulate an operation which releases the GIL most of the time.
- Parameters:
x – Input integer
- Returns:
The input value multiplied by 2
- scalable_op2(x: int) int[source]
Simulate an operation which releases the GIL some time.
- Parameters:
x – Input integer
- Returns:
The input value plus 100
- op_with_contention(x: int) int[source]
Simulate an operation holds the GIL.
- Parameters:
x – Input integer
- Returns:
The input value squared
- create_pipeline(num_sources: int = 1000) PipelineConfig[int, int][source]
Create a pipeline configuration with multiple stages.
- Parameters:
num_sources – Number of source items to generate
- Returns:
Pipeline configuration with three processing stages
- print_profile_result(result: ProfileResult) None[source]
Print profiling result in a formatted way.
This is a callback function that will be called after each stage is profiled.
- Parameters:
result – Profiling result for a single stage
- plot_profile_results(results: Sequence[ProfileResult], output_path: Path | None = None) None[source]
Plot profiling results showing QPS vs concurrency for each stage.
- Parameters:
results – List of profiling results for each pipeline stage
output_path – Optional path to save the plot. If None, displays the plot.
- run_profiling_example(num_inputs: int = 500) Sequence[ProfileResult][source]
Run the profiling example.
- Parameters:
num_inputs – Number of inputs to use for profiling
- Returns:
List of profiling results for each stage