Graphs
Description
The Quest Graph Visualizer is a sophisticated VR application designed to render interactive 3D graphs, offering a dynamic and immersive way to explore mathematical functions and partial derivatives. This app is particularly useful for users interested in visualizing complex mathematical landscapes.
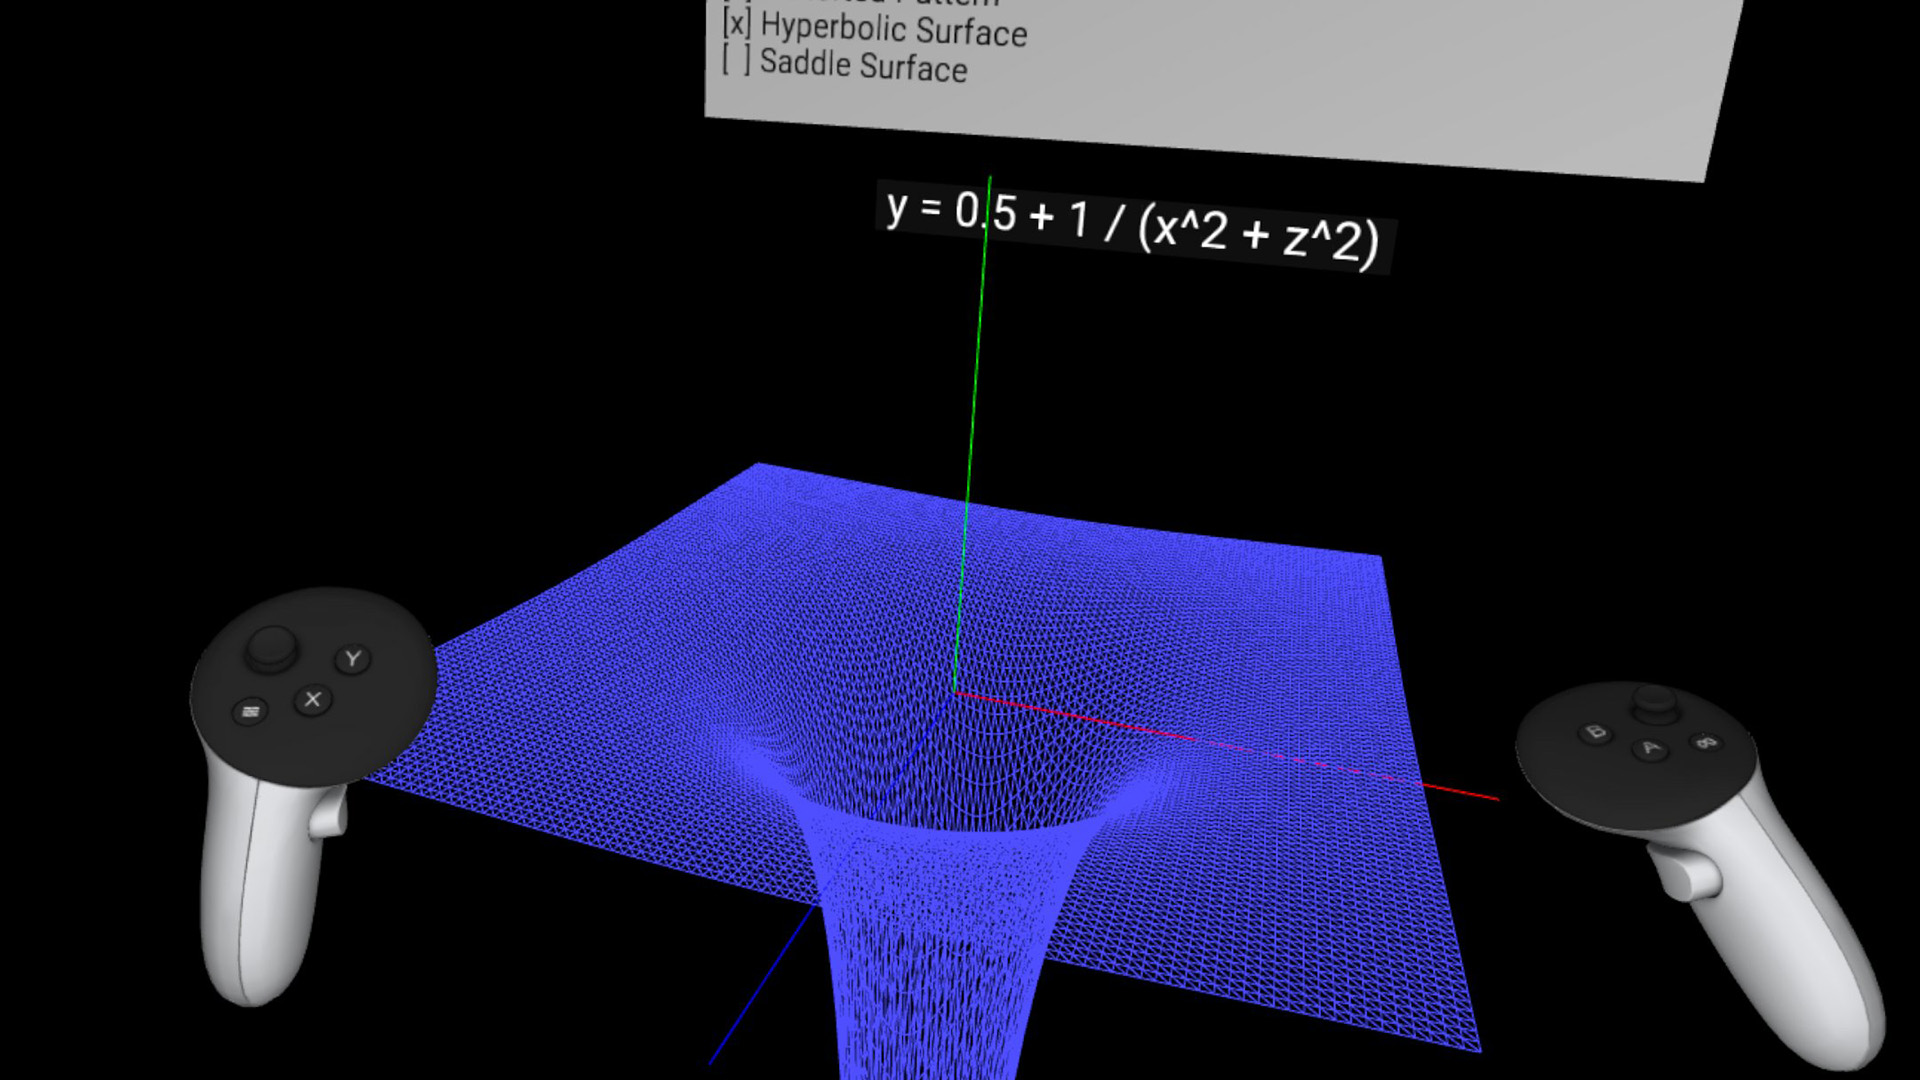
The app presents a menu from which users can select predefined 3D functions, ranging from simple sinusoidal wave functions to more complex shapes like a torus or a hyperbolic surface. Users can select a function using the controllers. Once a menu entry is selected, the mesh of the 3D function is calculated and visualized in front of the user. Users can change the visualization mode, for example, switching from a solid surface to a wireframe mode, or toggling normals on and off (by clicking the controller buttons). Additionally, after setting the controllers aside, users can visualize a Gradient Descent path at arbitrary locations using simple hand interactions: the left hand points with the index finger to select the intersection point on the surface, while the right hand projects the fingertips onto the function's surface.
Adding a new 3D function for visualization is straightforward — simply provide the function pointer to the new function to be visualized. The app utilizes Ocean's AutomaticDifferentiation functionality to automatically calculate the function values and their partial derivatives.
Furthermore, a custom scale and visualization boundary can be defined for each graph to ensure that only a specific part of the function is visualized. This demo serves as an excellent introduction to Ocean's mathematical capabilities and demonstrates how to customize and adjust 3D meshes for rendering.
Building
The following instructions are for macOS but can be easily converted to other host operating systems. First, ensure that the
have been completed. And that the third-party libraries have been built according to these instructions.
Then run the following steps:
# Define environment variables required for Android and Quest apps as per setup instructions above:
# ANDROID_HOME, ANDROID_NDK, ANDROID_NDK_VERSION, JAVA_HOME, and OVRPlatformSDK_ROOT

# Adjust this to your location of the third-party libraries
export OCEAN_THIRDPARTY_PATH="${HOME}/install_ocean_thirdparty"

cd /path/to/ocean/build/gradle/application/ocean/demo/platform/meta/quest/openxr/graphs/quest

./gradlew assemble

# Install debug build of the app
adb install app/build/outputs/apk/debug/app-debug.apk

# Install release build of the app
adb install app/build/outputs/apk/release/app-release.apk
Features
- 3D Graph Rendering: Displays mathematical functions in 3D.
- Visualization Options: Switch between solid, wireframe, and normals views.
- Hand-Gesture Interaction: Explore Gradient Descent paths with hand movements.
- Automatic Differentiation: Computes values and derivatives automatically.
Educational and Immersive
- Hands-On Learning: Direct interaction with mathematical concepts.
- Visualizing Complex Concepts: Makes abstract math tangible and visual.