Getting Started
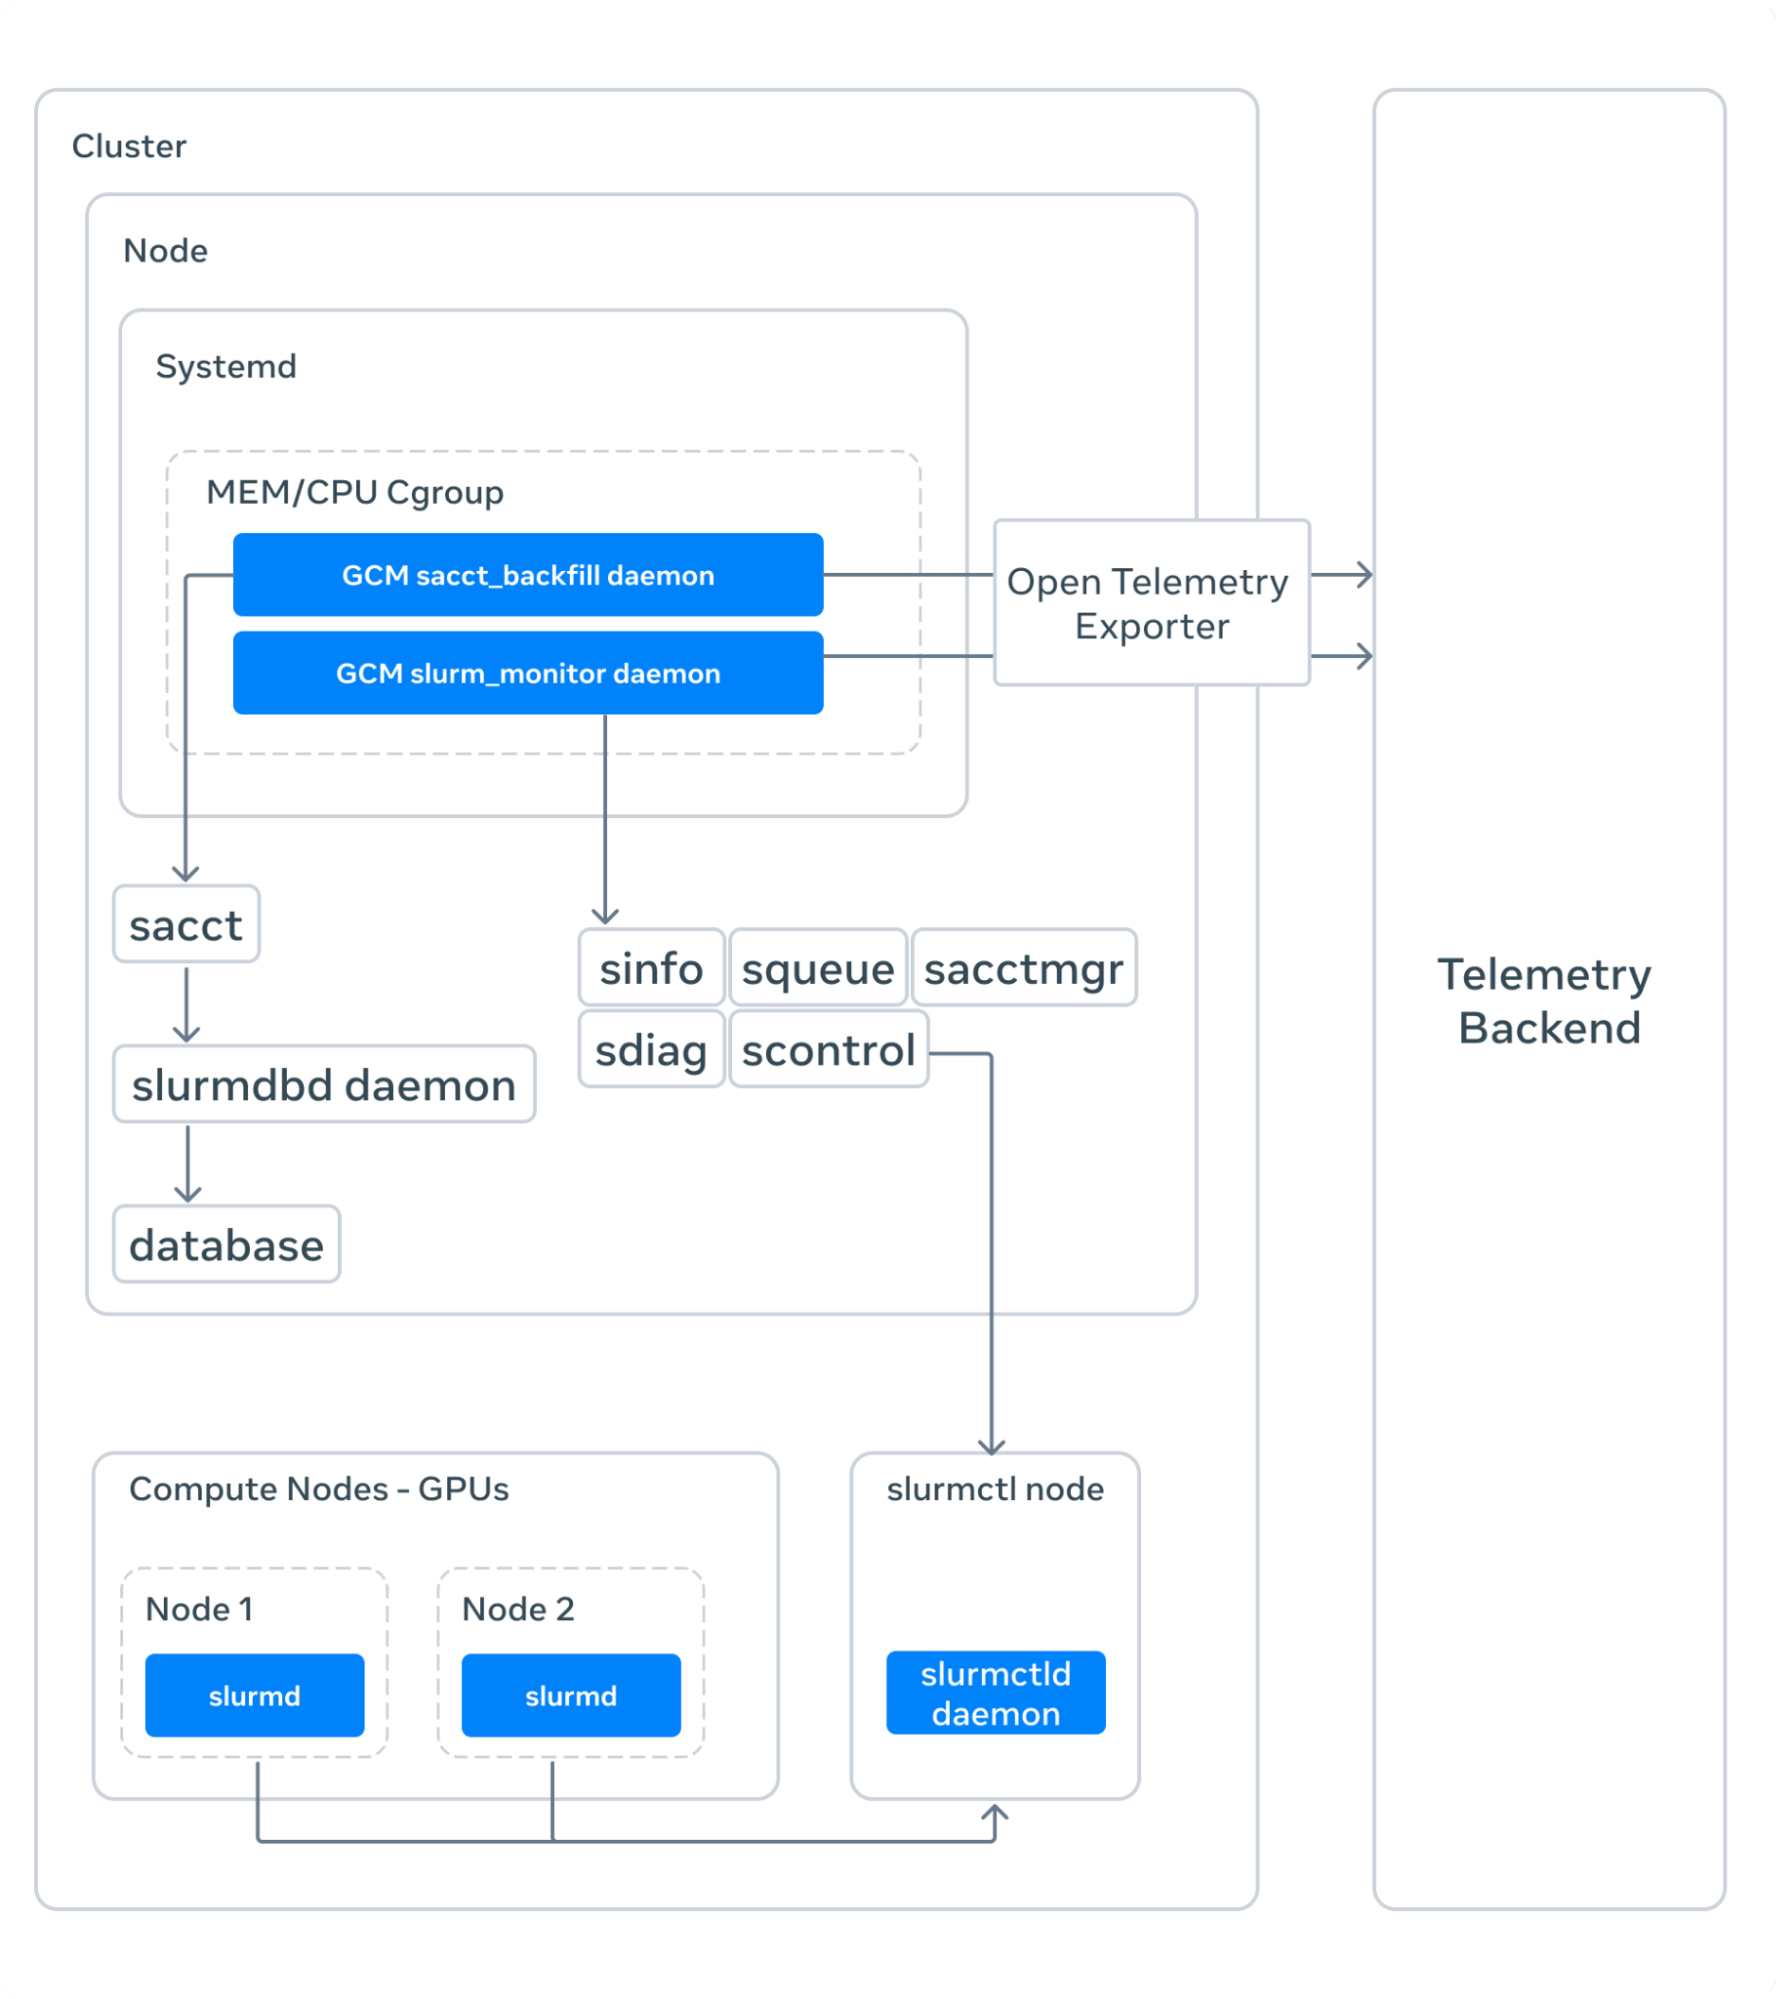
GCM Monitoring is a Python CLI with a series of collectors that collect Slurm and GPU (NVML) data in a loop and publish it to a given exporter.
For a cluster-level view of GCM Monitoring:
On a Kubernetes environment:

Quick Start Guide
Requirements
- Python 3.10+
- pynvml (for GPU monitoring features)
- Slurm (for job scheduler integration)
Installation
pip install gpucm
Install from Github
# Latest main
pip install --upgrade git+ssh://git@github.com:facebookresearch/gcm.git@main

# Specific release
pip install --upgrade git+ssh://git@github.com:facebookresearch/gcm.git@<release>
CLI
After installing gcm you should be able to call it via the CLI:
$ gcm --help
Usage: gcm [OPTIONS] COMMAND [ARGS]...

  GPU Cluster Monitoring: Large-Scale AI Research Cluster Monitoring.

Options:
  --config FILE  Load option values from table 'gcm' in the given TOML config
                 file. A non-existent path or '/dev/null' are ignored and
                 treated as empty tables.  [default: /etc/fb-gcm/config.toml]
  -d, --detach   Exit immediately instead of waiting for GCM to run.
  --version      Show the version and exit.
  --help         Show this message and exit.

Commands:
  fsacct
  nvml_monitor       Script for reading gpu metrics on the node.
  sacct_backfill     A script to backfill sacct data into sink.
  sacct_publish      Take the output of sacct SACCT_OUTPUT in the...
  sacct_running      Collects slurm running jobs through sacct and sends...
  sacctmgr_qos       Collects slurm QOS information and sends to sink.
  sacctmgr_user      Collects slurm user information and sends to sink.
  scontrol           Collects slurm scontrol partition information and...
  scontrol_config    Collects slurm scontrol config information and sends...
  slurm_job_monitor  Retrieve SLURM node and job metrics.
  slurm_monitor      Publish SLURM metrics and logs from sacct, sdiag,...
  storage            Collects slurm storage partition information and...
GCM Collectors
Check out GCM Collectors documentation for a list of supported collectors.
Each collector can be invoked via the CLI:
$ gcm <collector> --help
At a high level you can think of the collection above as a daemon that runs non-stop, collects some data at every X interval, and exports it.
Configuration Files
GCM Monitoring supports TOML configuration files to simplify parameter management:
# FILE: cluster_config.toml

[gcm.slurm_monitor] <-- This is where you specific the collector name
# All CLI options are supported in the config file
...
sink = "otel"
sink_opts = [
  "otel_endpoint=https://otlp.observability-platform.com",
  "otel_timeout=60",
  "log_resource_attributes={'environment': 'production', 'cluster': 'gpu-cluster-a', 'region': 'us-west-2'}",
  "metric_resource_attributes={'environment': 'production', 'cluster': 'gpu-cluster-a', 'region': 'us-west-2'}",
]
You can then invoke the collector with the config file:
# Using config file for monitoring
gcm --config=/etc/cluster_config.toml slurm_monitor

# CLI arguments override config file values
gcm --config=/etc/cluster_config.toml slurm_monitor --sink=stdout --once
License
GCM Monitoring is licensed under the MIT License.